Composite Suspension-Capstone
Problem
-
Designing a composite lower control arm for a solar car’s suspension. The part will need to handle various loading conditions as the solar car hits bumps, corners, and brakes.
-
Simulations need to be performed to find critical stress concentration areas on the composite part.
-
Manufacture the part with special manufacturing processes for composites.
-
Test the part either in destructive or non-destrictive tests to verify the simualtion results.
Process
- Design: The design considered three possible designs and finally diverged to a sandwich panel design.
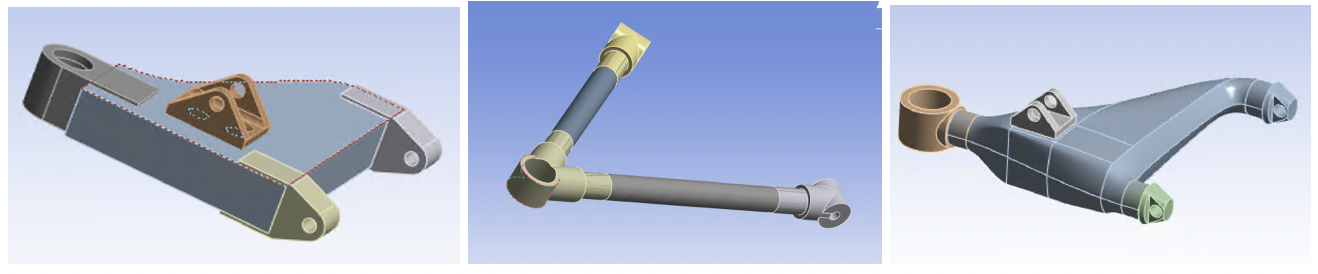 The three possible designs
Sandwich panels performed superior as the loading condition included bending; without bending tubular designs would have worked as commonly done in Formula 1 race cars as shown below.
 Formula 1 composite control arm design
However, with the design of the solar car’s suspension, a foam core was needed to make sure the fiber does not buckle locally and to dramatically increase the second moment of inertia against bending.
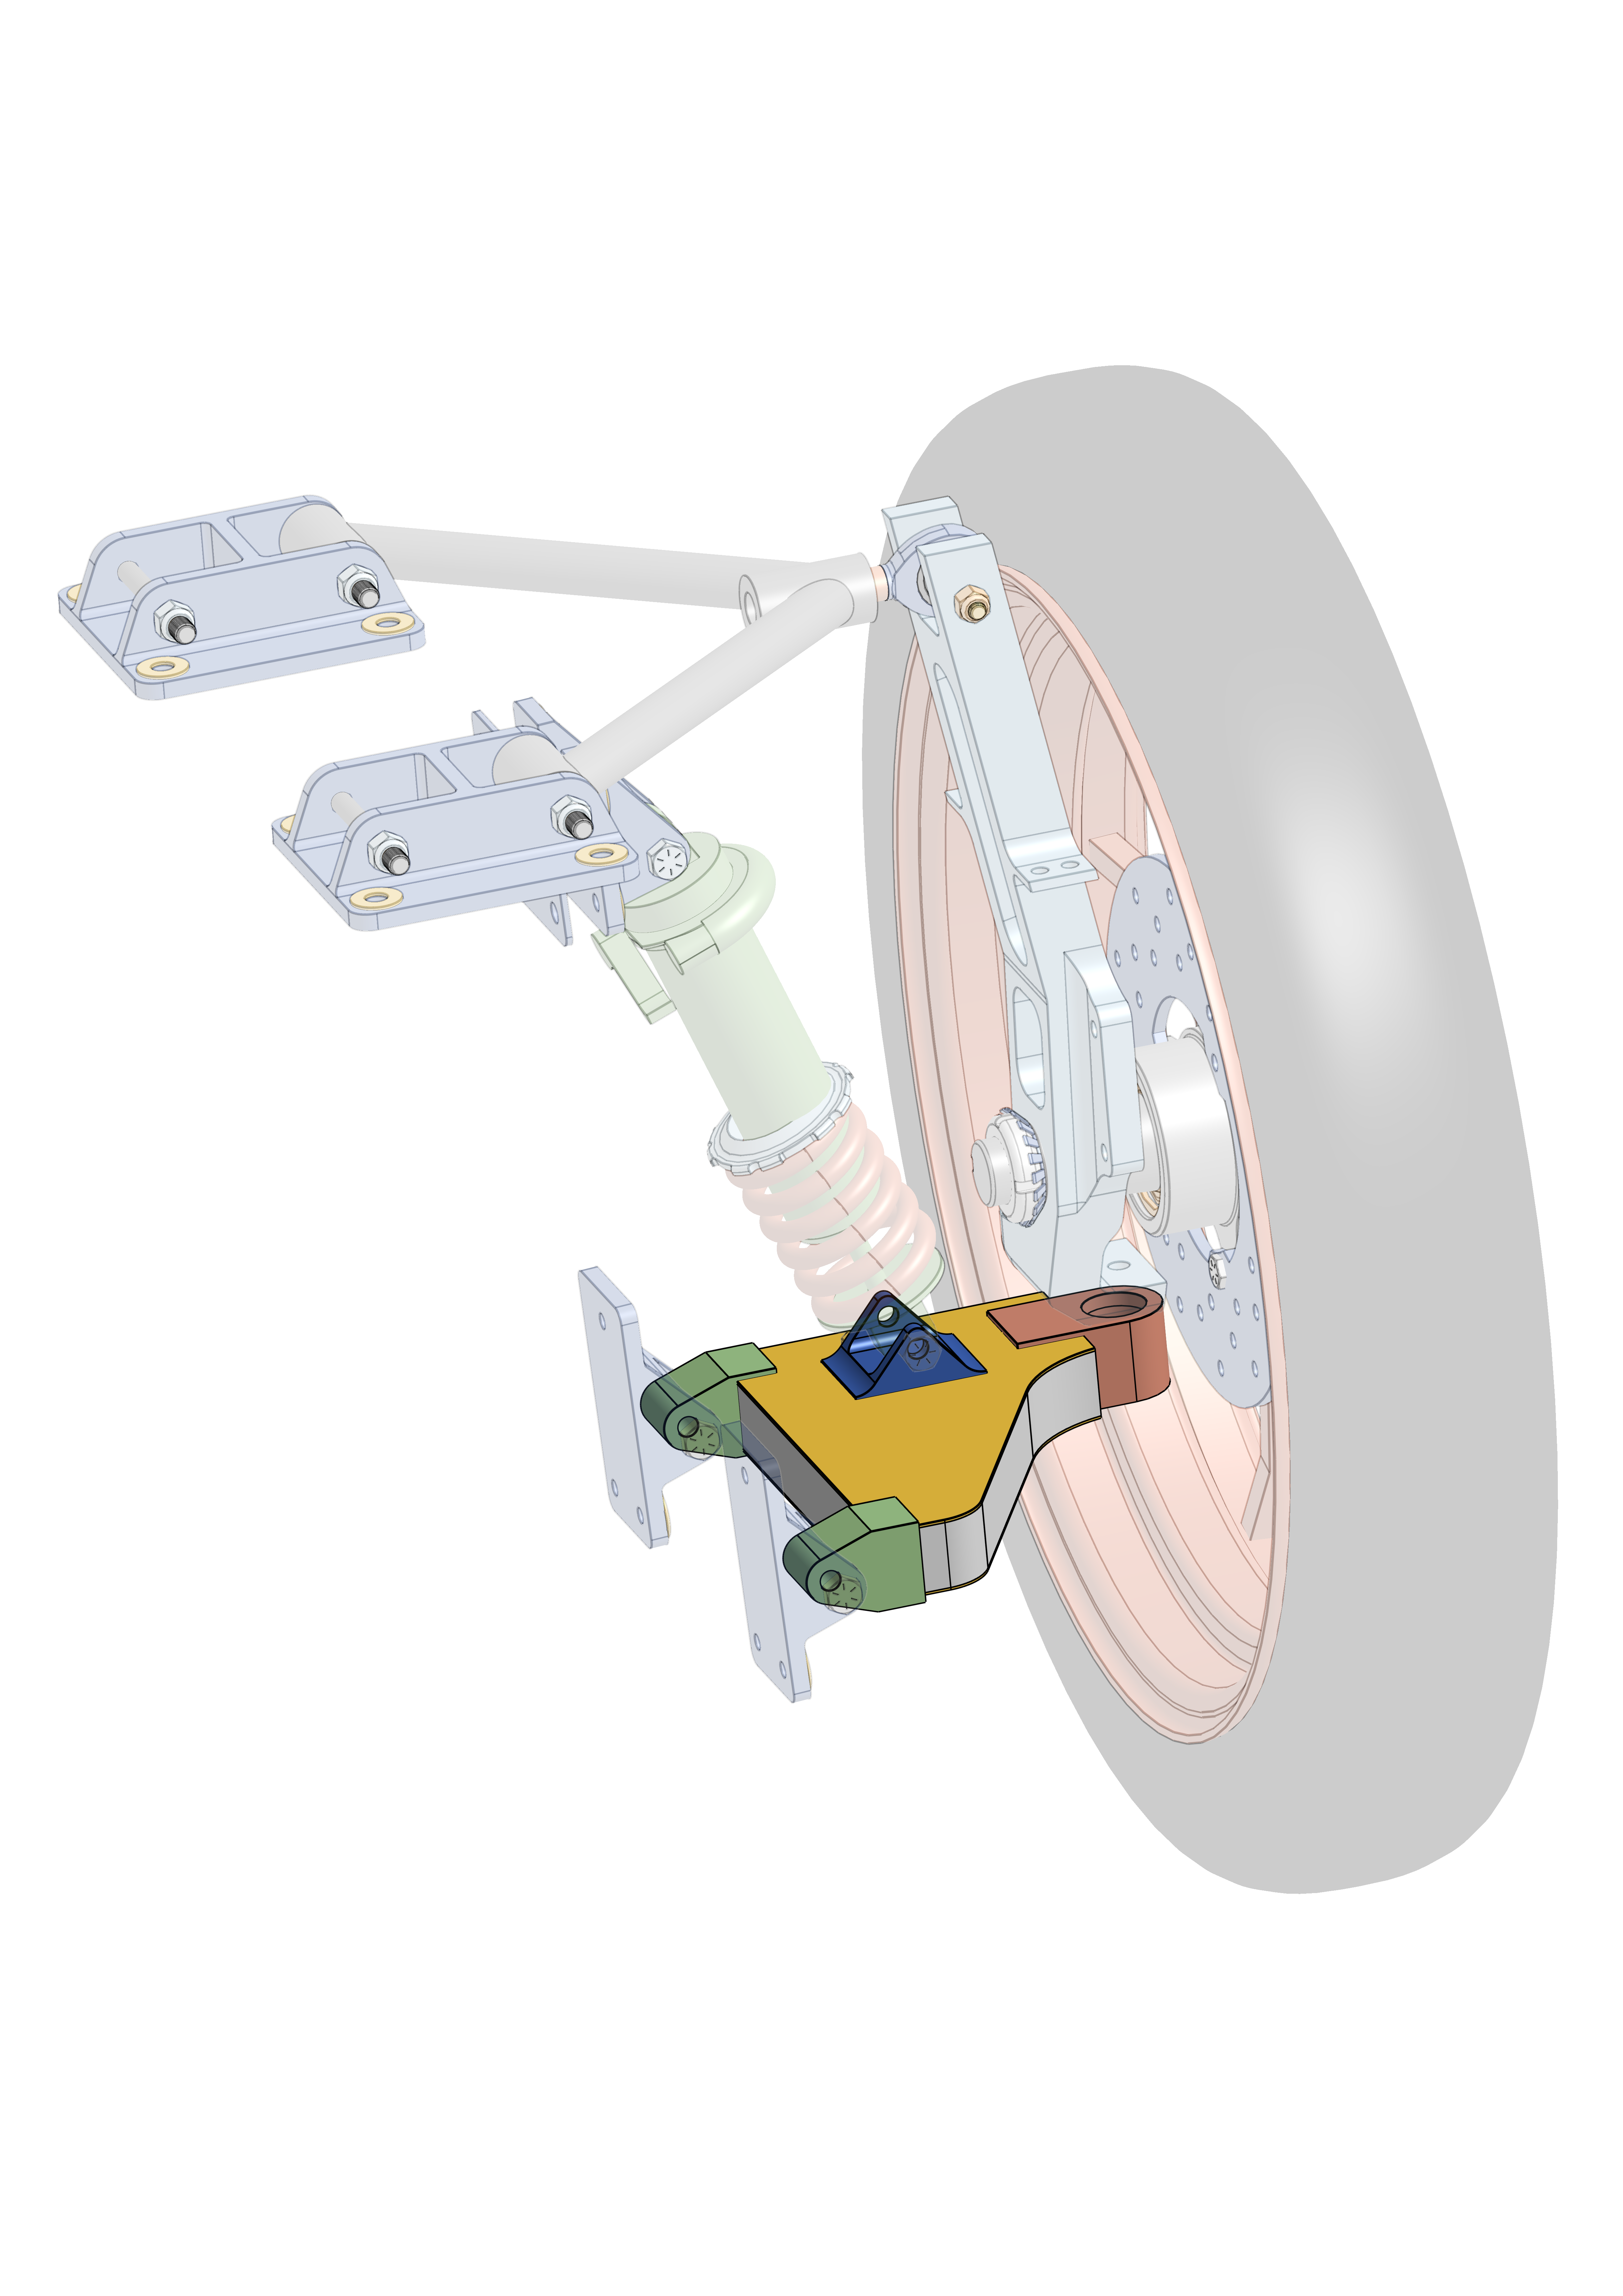 The lower control arm design within the suspension assembly
The image above shows the shock absorber connected to the middle of the lower control arm, exhausting considerable force in bumps causing a three-point bend phenomenon on the control arm.
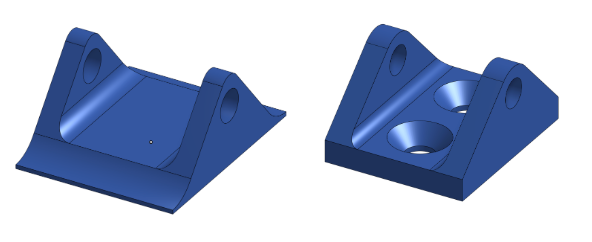
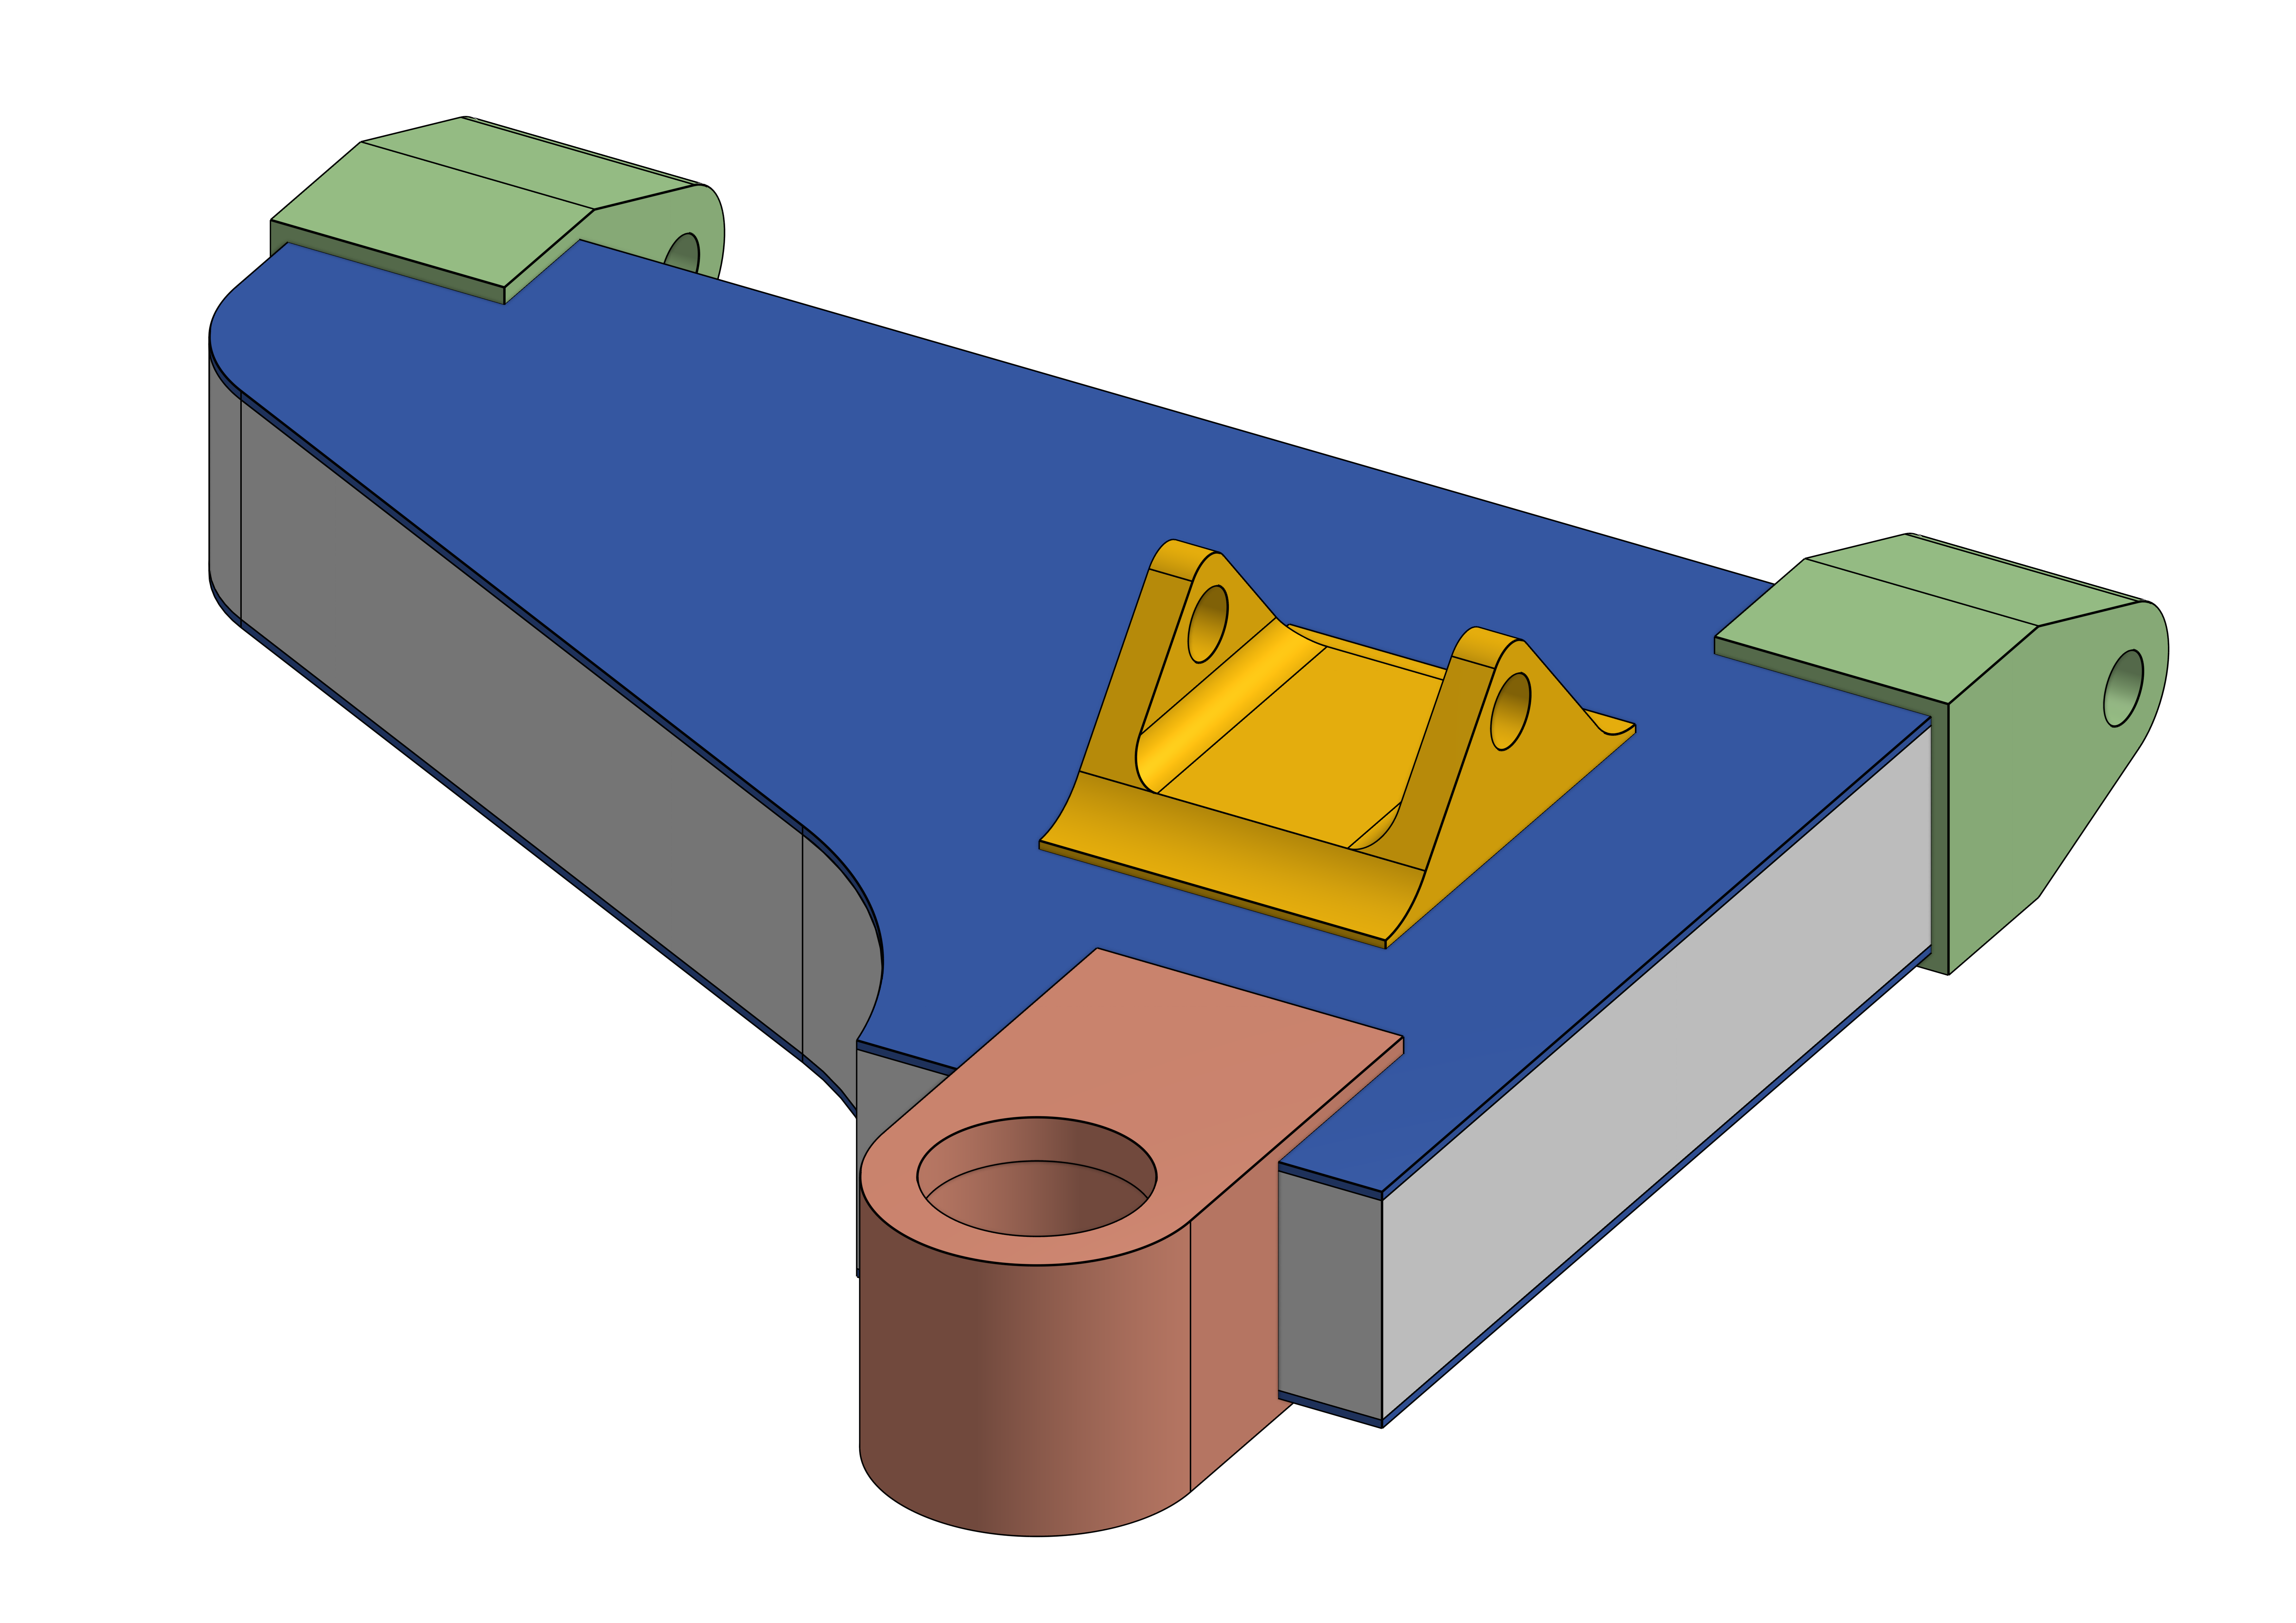 CAD design with metal attachements
The final design consisted of 8 layers of spreadtow carbon fiber with a 1” Rohacell 200 HERO in between. This design increased bending strength considerably than non-sandwich panel designs, attachments to chassis and wheel was done through metal parts attached with epoxy adhesives.
Morevoer, the load path analysis on the suspension was performed to find loads in different driving scenarios of bump, brake, and turn. The image below shows a part of the free-body diagram analysis.
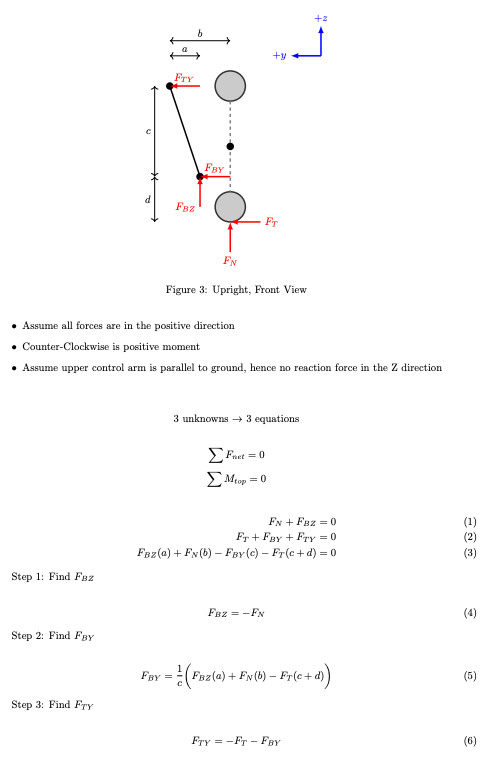 Free-body diagram of the suspension in YZ plane
The free-body diagram equations was fed into MATLAB to find the point loads based on different driving conditions. The table below is the point loads.
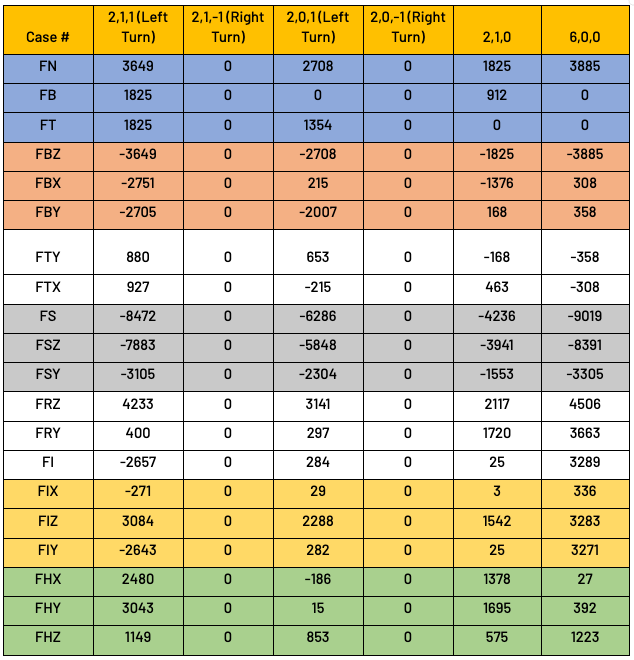 CAD design with metal attachments
Finally, theoretical analysis was performed on the final design before simulations. A three-point bend model was used for the analysis. T. C. TRIANTAFILLOU and L. J. GIBSON provide the necessary equations for various failure modes as shown in the table below.
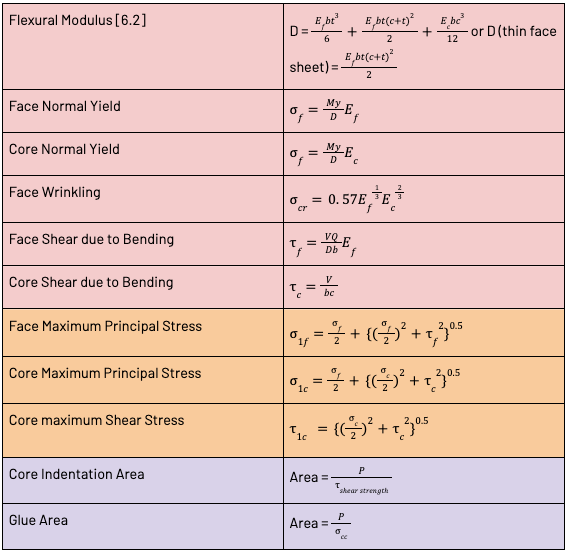 T. C. TRIANTAFILLOU and L. J. GIBSON failure equations for a sandwich panel
- Simulations: Simulated the designs in ANSYS Composite PrepPost (ACP), applying Maximum Stress and Strain criteria for conservative estimates and Tsai-Wu theory for more accurate results. Material data was acquired from Blue Sky team material data through coupon tests, the load points found previously was used as boundary conditions; FEA results were compared against throretical calculations.
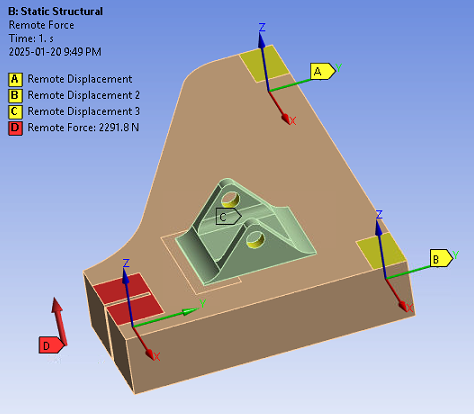 Boundary conditions of the sandwich panel design in ANSYS
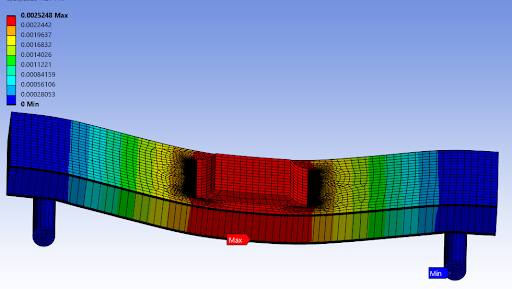
The highest stress in the component was found at the shock interface where the sharp edge of the metal indents the core and causes failure.
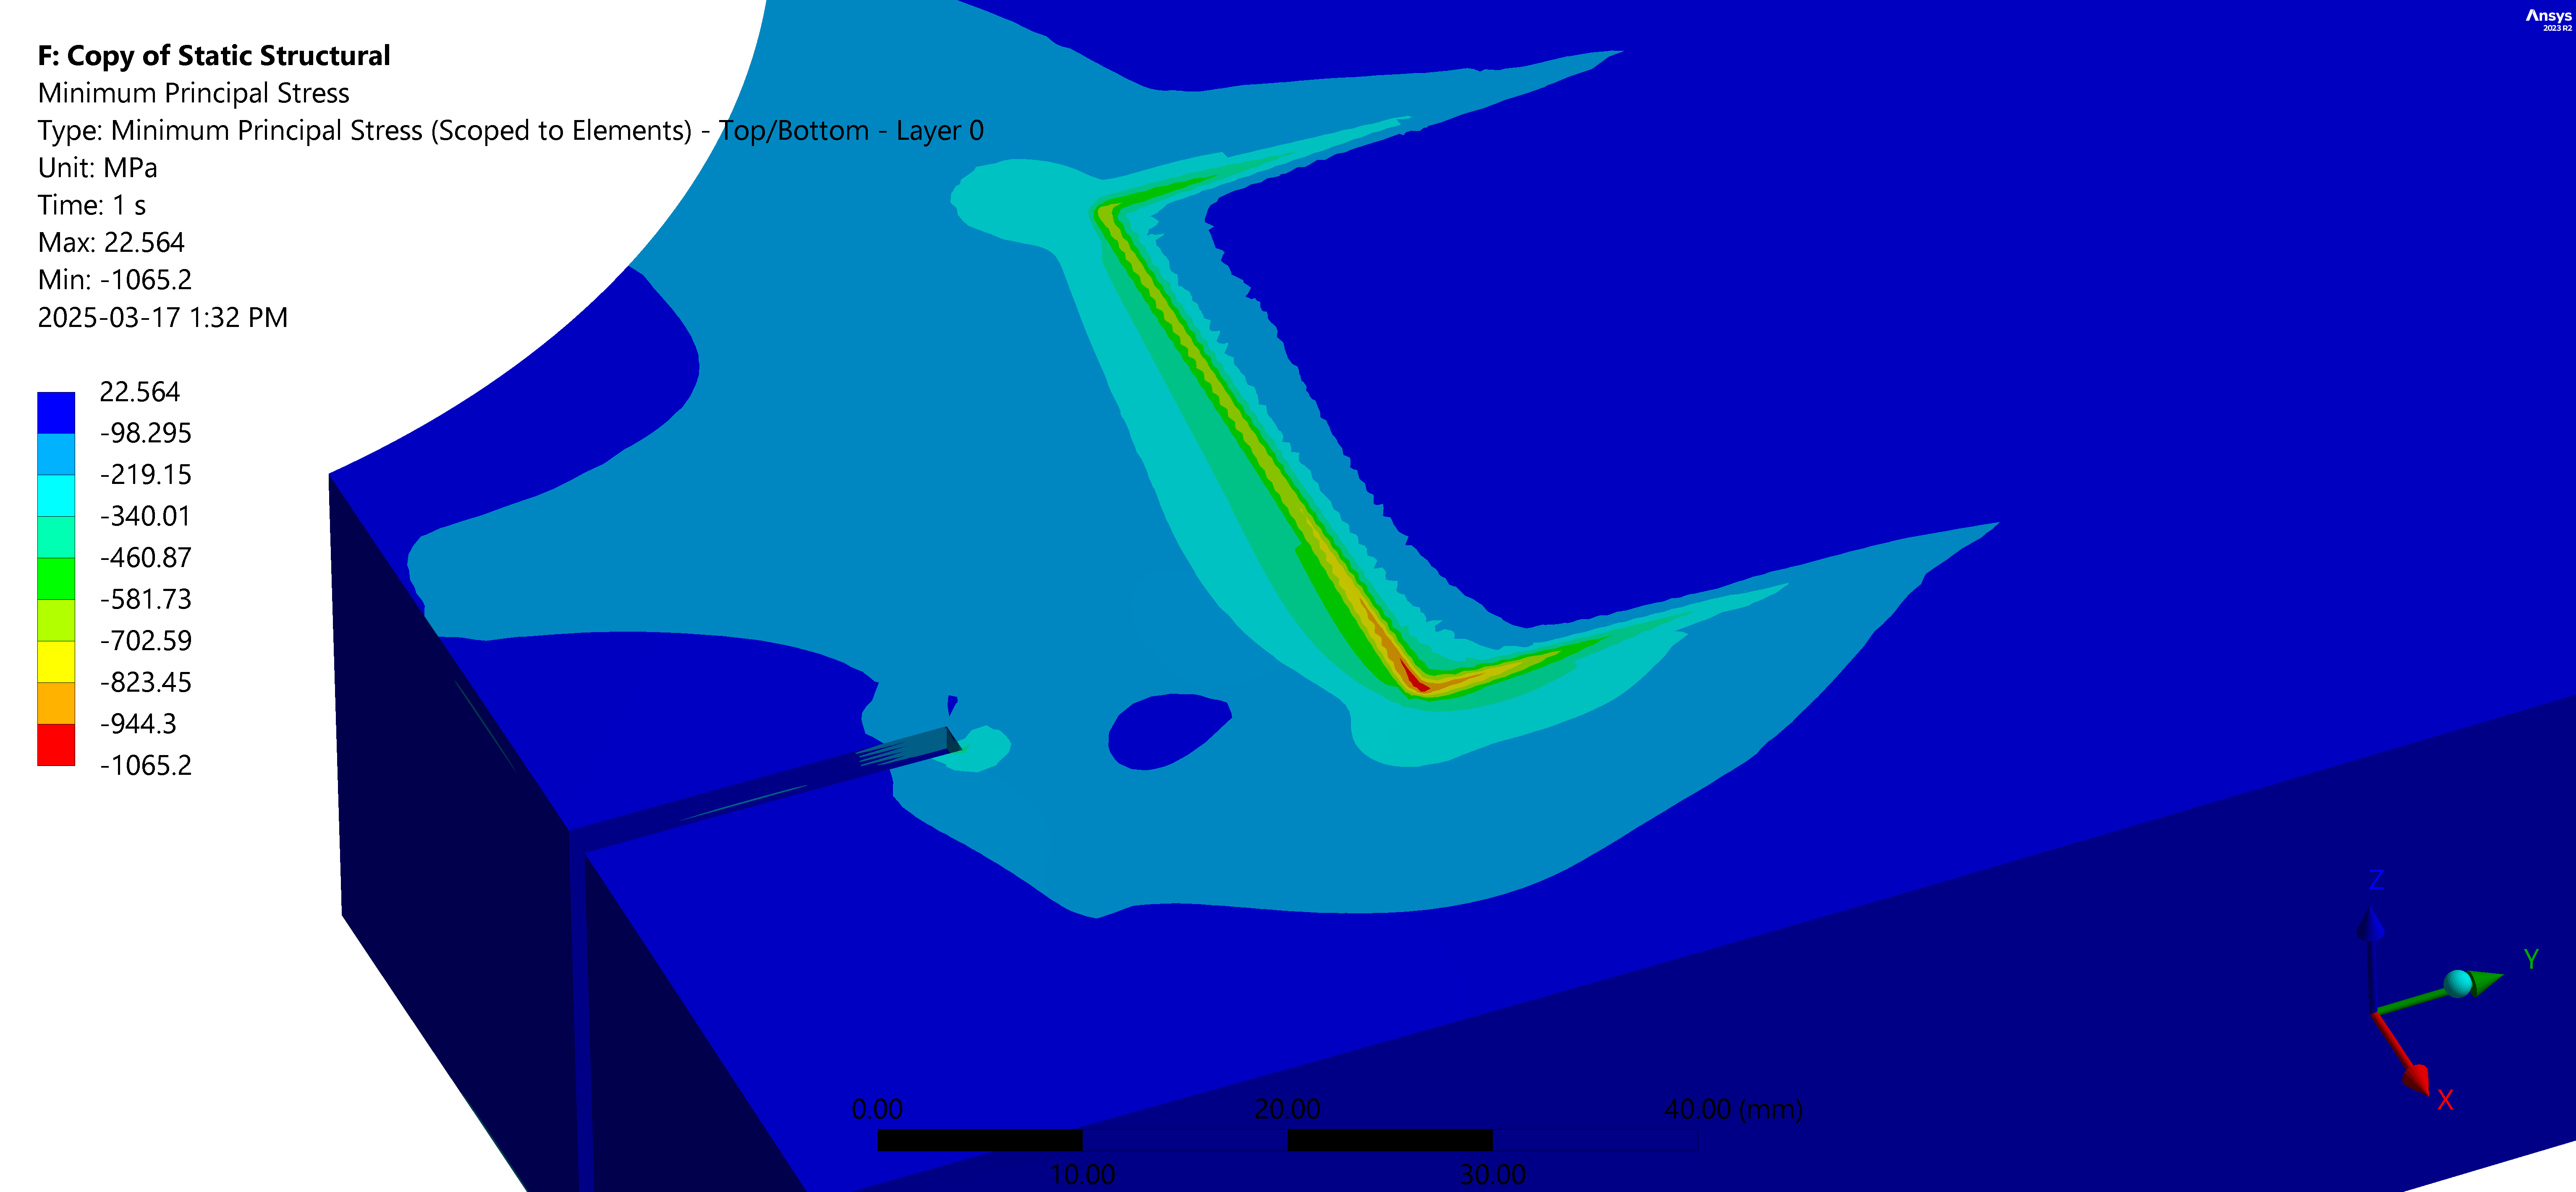 Simulation results showing critical stress at the shock interface
Therefore, the metal clevis was redesigned to reduce stress concentration as shown below. This resulted in reducing stress dramatically, achieving the desired safety factor of 1.5. Moreover, the fiber layers and core thickness were parameterized to reach an optimal design for strength.
 Redesign of the clevis included a fillet to distribute the stress
- Manufacture: The component was manufactured with spread-tow fiber and ROHACELL 200 HERO foam. Initially, vacuum infusion was used. However, epoxy failed to wet all the layers as spread-tow is densely packed. Therefore, for the second trial wet-layup method was used, even though wet-layup increases manufacturing inconsistency, it allows all the layers to my wetted as desired.
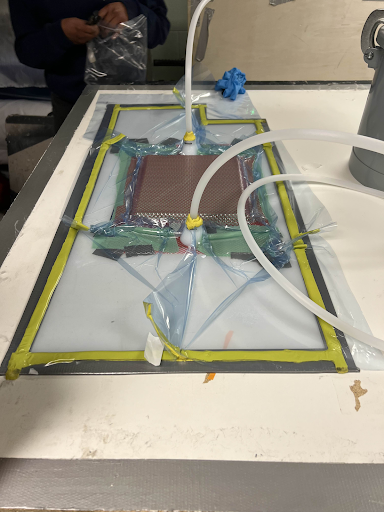 Vacuum infusion of the part
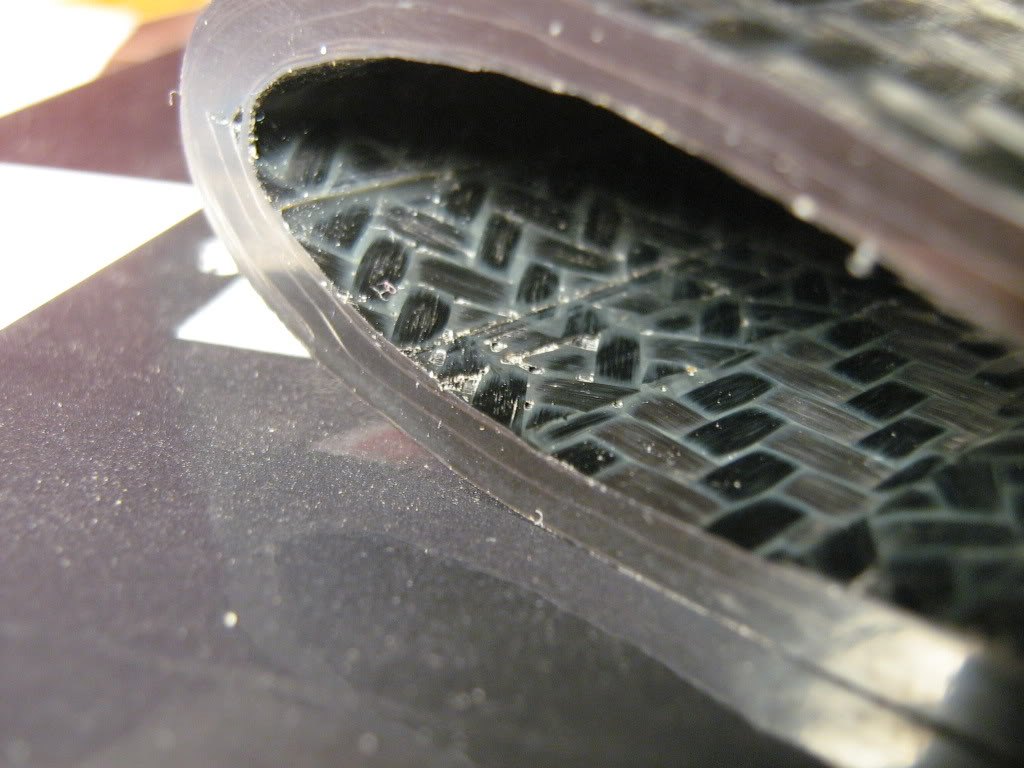
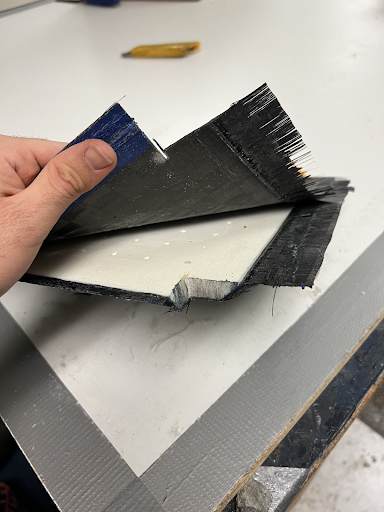 Delamination due to epoxy no wetting all the layers
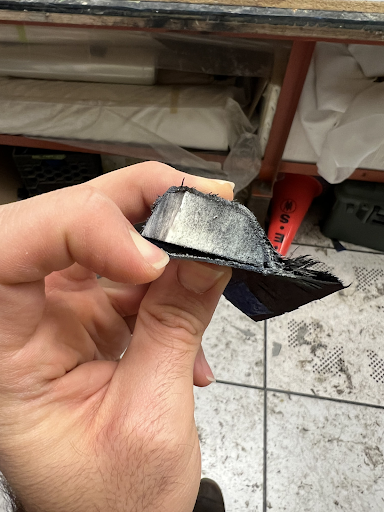 Delamination
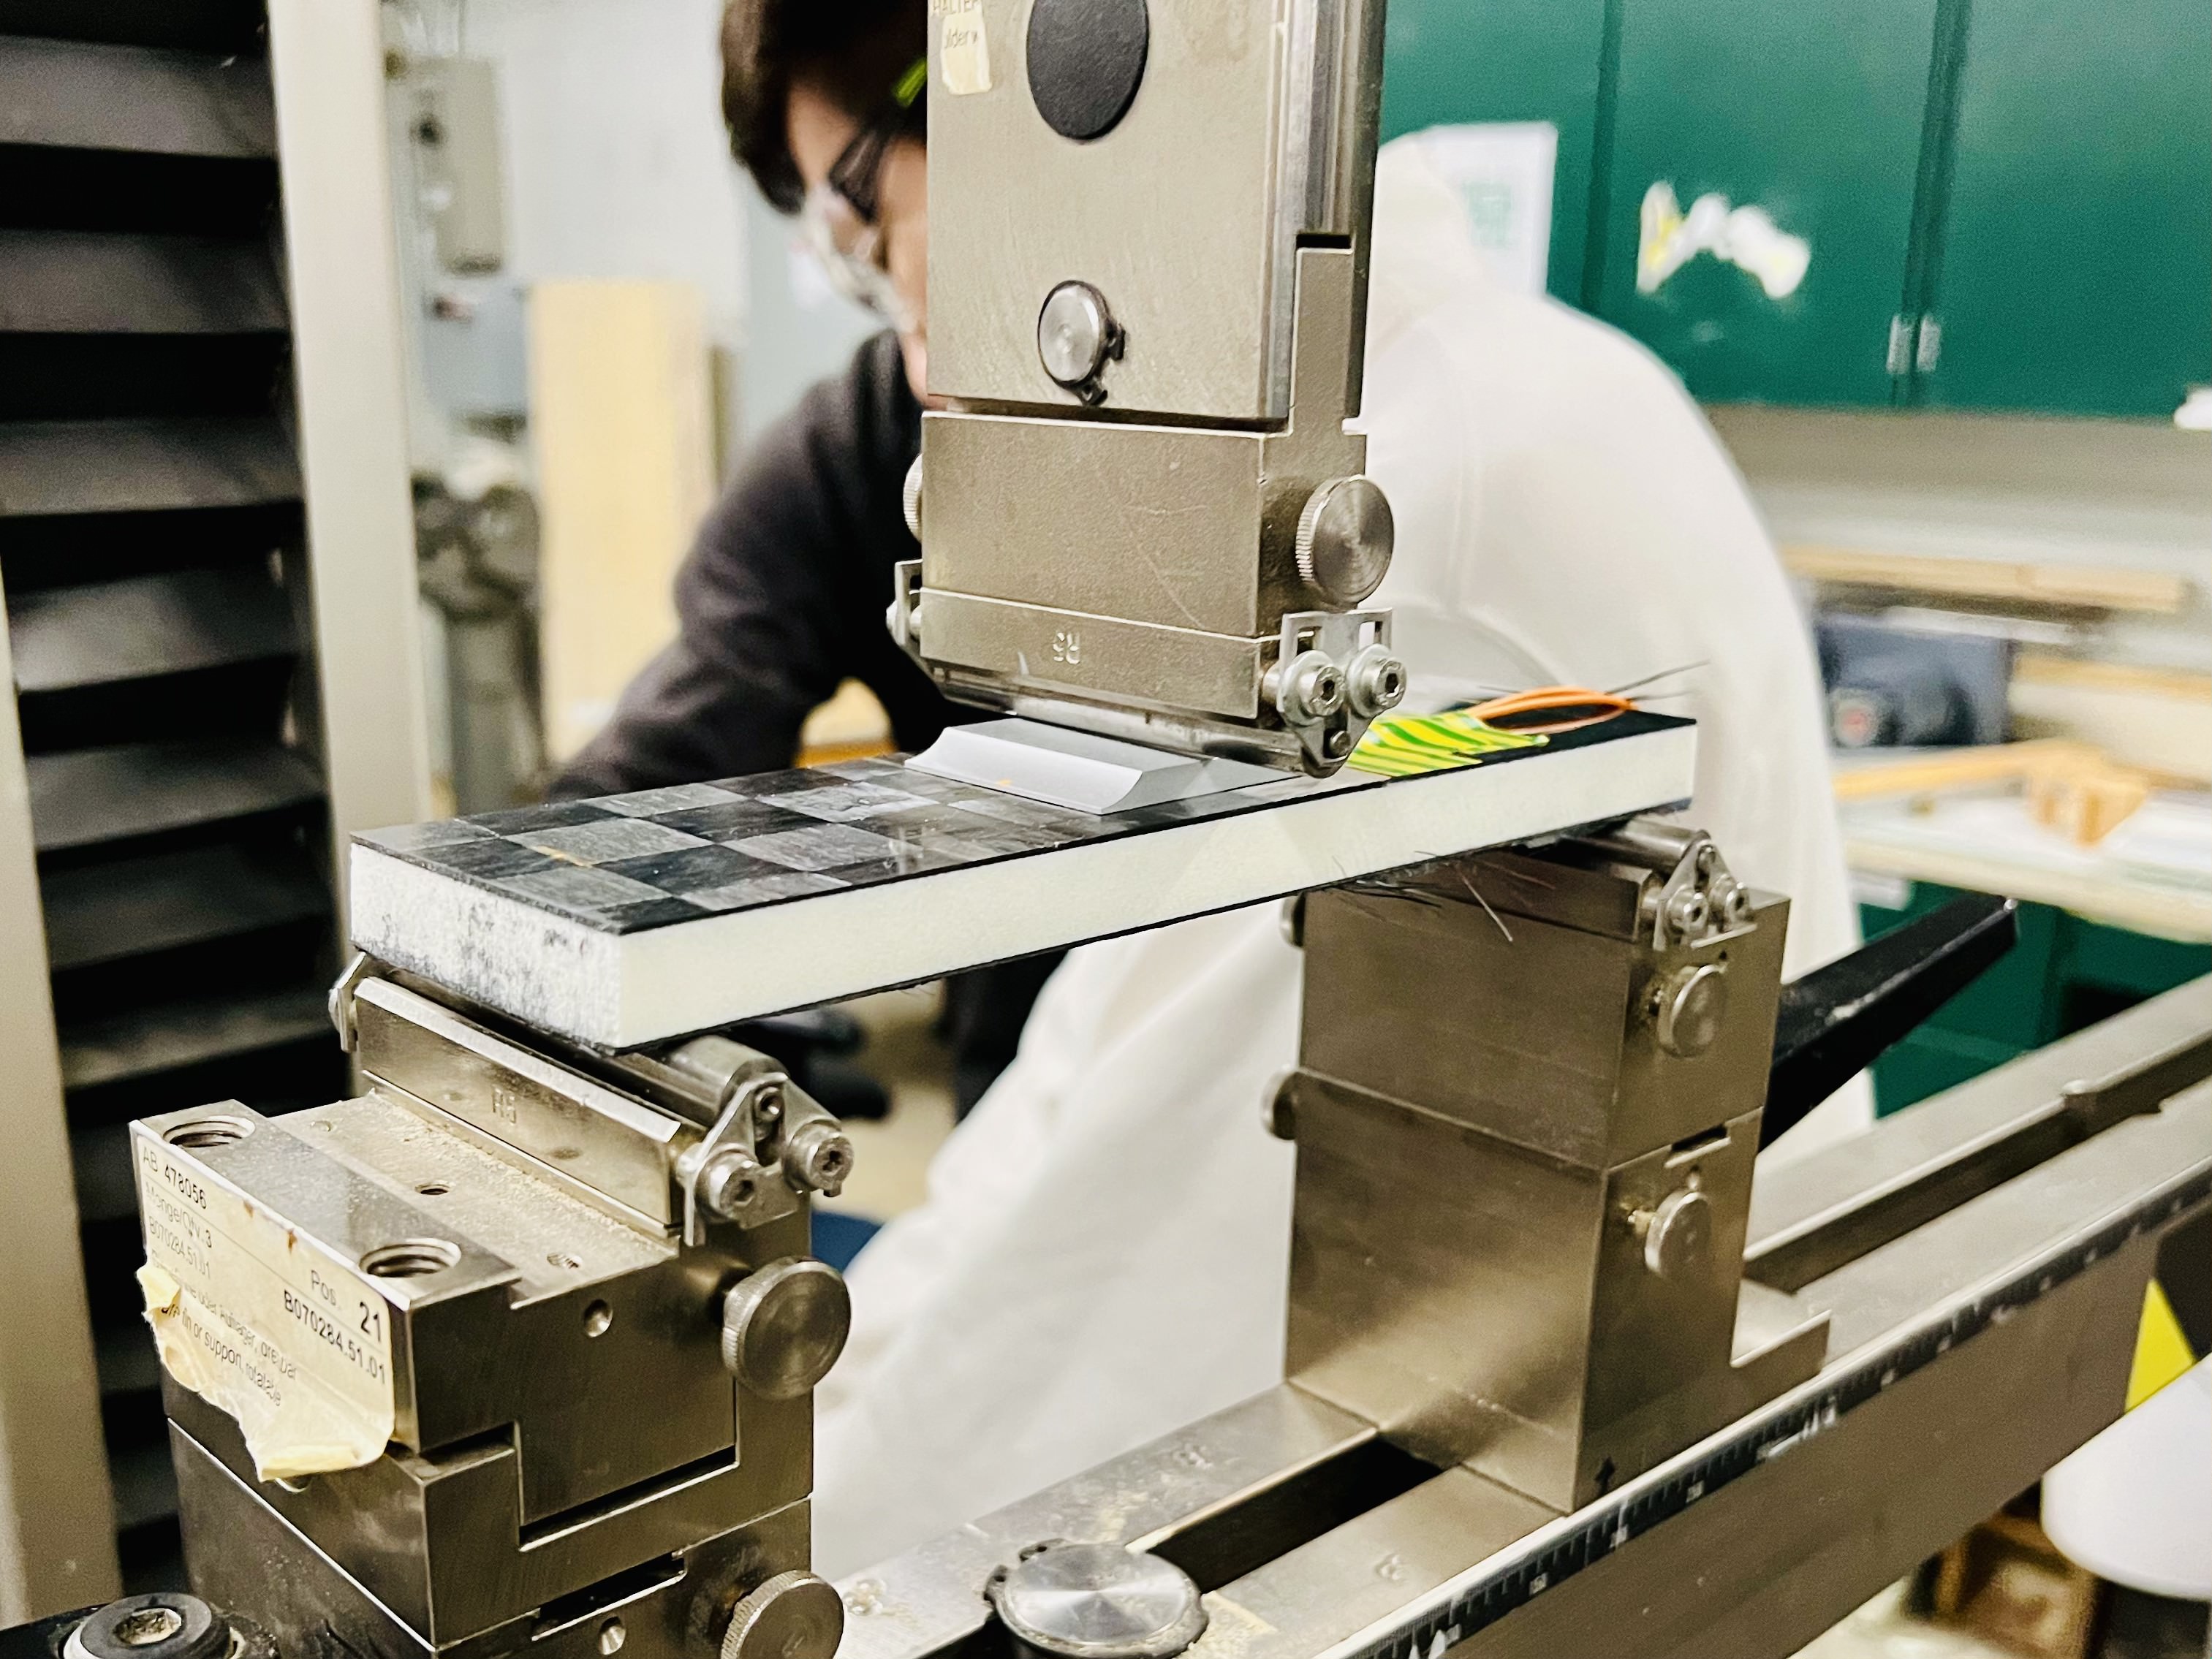
- Test: The manufactured part was cut into a rectangular section containing the critical stress location. The sample was put in a three-point bend test to compare simulation results to test results for verification.
 Simulation of the rectangular section in ANSYS
Testing the rectangular section on an Intron machine to compare to simulation results
Simulation of the rectangular section in ANSYS
Testing the rectangular section on an Intron machine to compare to simulation results
Results
The sample failed at 6000 N. It’s important to note the tested sample was 1/2 inch in thickness, the designed thickness was 1 inch, however, we were not able to get such a thickness in time for testing. To overcome this, we theoretically were able to translate the desired failure load point to 1/2 inch and the goal was 6000 N and we achieved it with a final safety factor of 1.4.
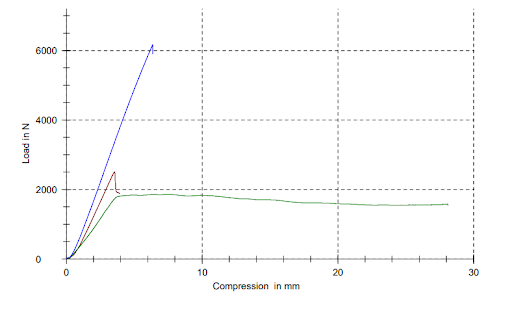 The blue line is with the filleted metal clevis design. The sample failed at a safety factor of 1.4