Chief Engineer of Blue Sky Solar Racing
Blue Sky Solar Racing website: www.blueskysolar.org
Table of Contents
- Blue Sky Solar Racing
- The 2023 Race
- My Role as Chief Engineer
-
Testing of the Solar Car
Blue Sky Solar Racing
Blue Sky Solar Racing is a student-led design team at the University of Toronto, that has built and raced solar cars for over 25 years. During the 2020-2023 cycle, the team was building the 11th generation solar car, named Borealis, set to race in the World Solar Challenge of 2023.
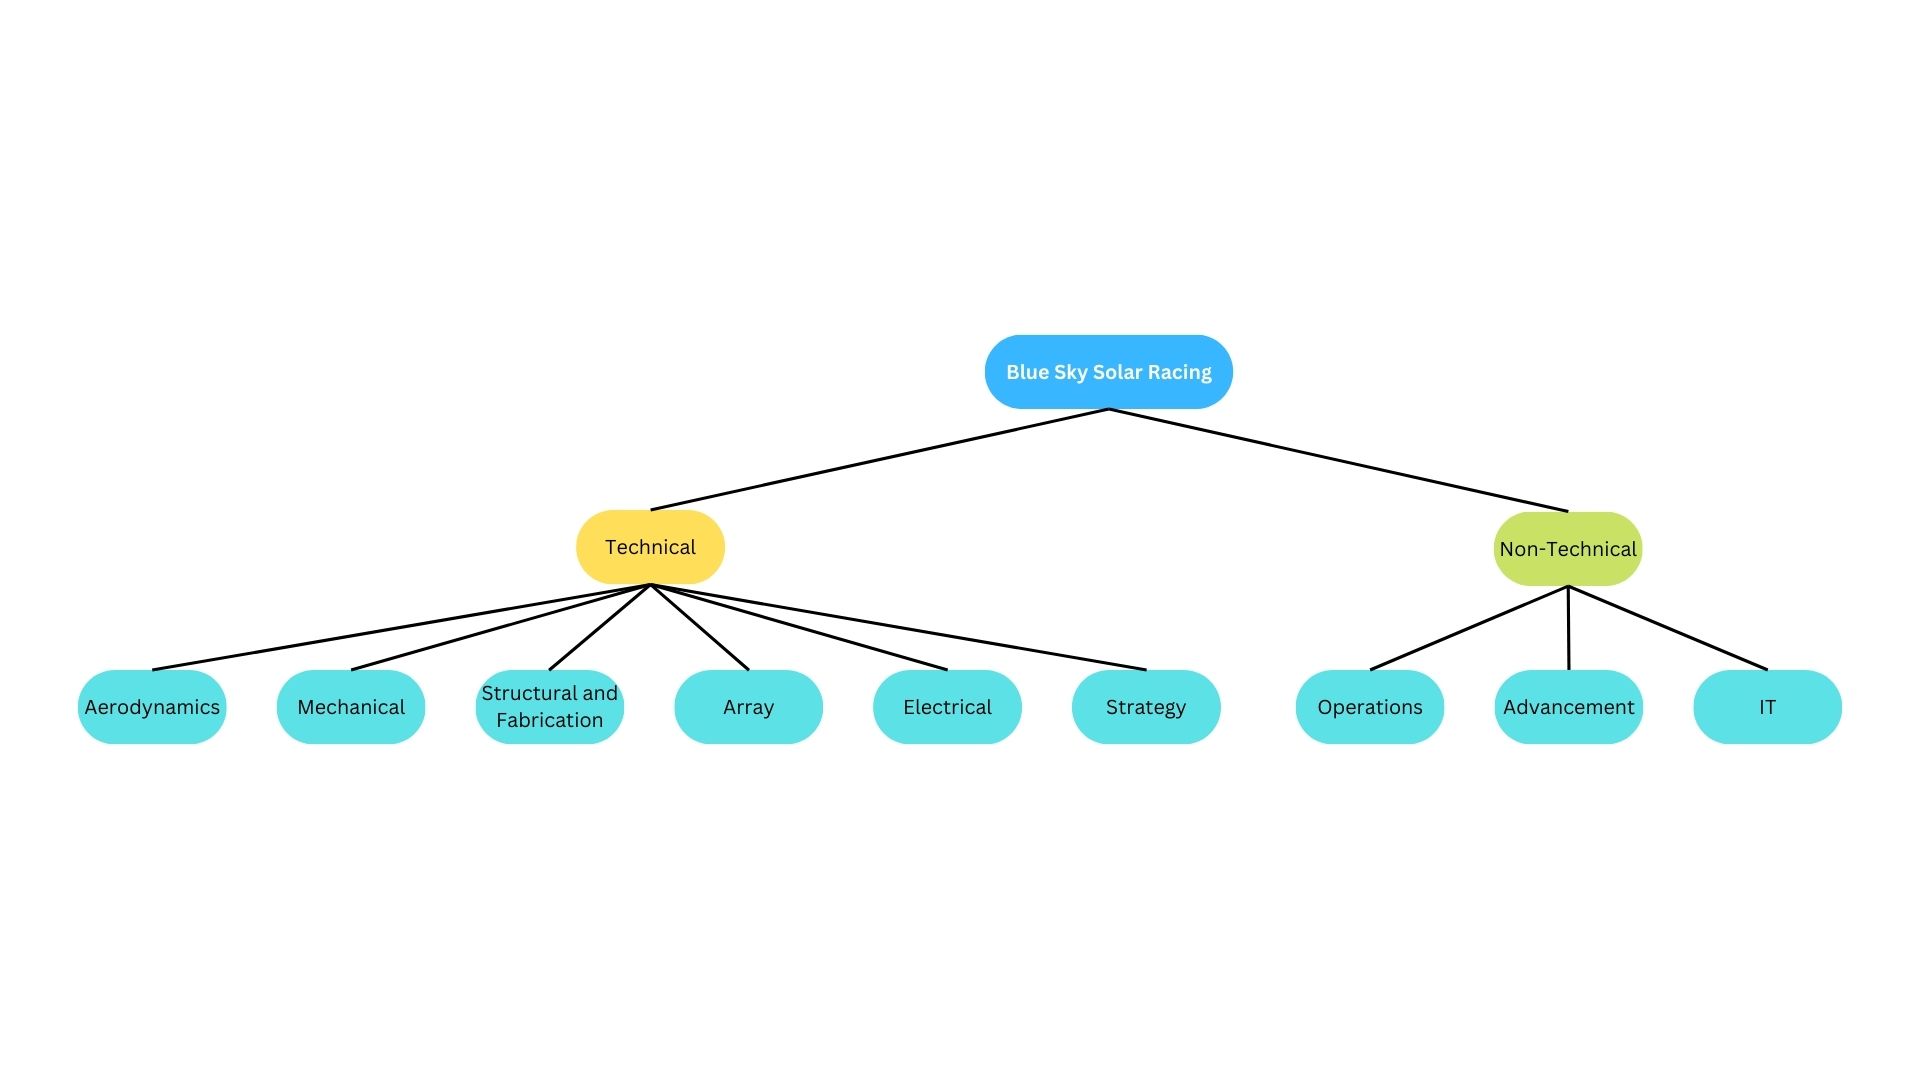
The team was composed of 78 students and 9 subteams. Each subteam is composed of several members with one or two subteam leads in the supervisory role.
My Role as Chief Engineer
The chief engineer takes responsibility for all the technical subteams. I took the role of Chief Engineer from September 2022 until the race concluded in October 2023. As a chief engineer, I had several major responsibilities:
- Create timelines for technical subteams
- Ensure compliance of the solar car to regulations
- Direct the design and manufacturing decisions with subteam leads
- Engage sponsors to secure materials, machining, and technical supports
- Testing the roadworthiness of the solar car on actual tracks
The 2023 Race
Some cool videos of the race:
- A short drone footage: Blue Sky Solar Racing Highlight Reel 4k Bridgestone World Solar Challenge 2023 (Youtube)
- A long race drone footage: Blue Sky Solar Racing BWSC 2023 Recap 1080p (Youtube)
Images from the race: flickr
The 2023 World Solar Challenge held special significance for our team. The COVID-19 pandemic resulted in the cancellation of the 2021 race, halting our participation for four years. As we finally returned to compete, there was a palpable sense of newness and enthusiasm among the team members, fueled by the excitement of resuming the race after such a prolonged hiatus.
The event held particular importance as it allowed us to recommence our commitment to the mission of sustainability and the nurturing of future engineers. However, this return also posed a unique challenge: the absence of prior race experience among team members.
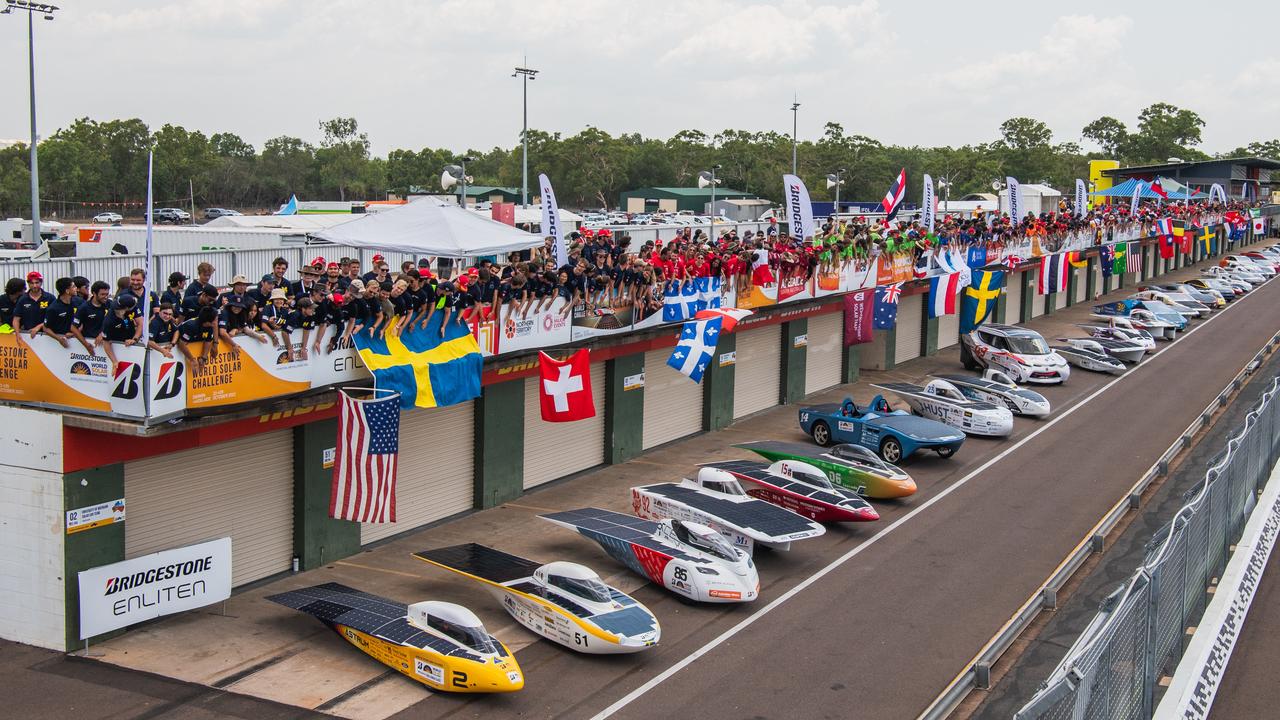
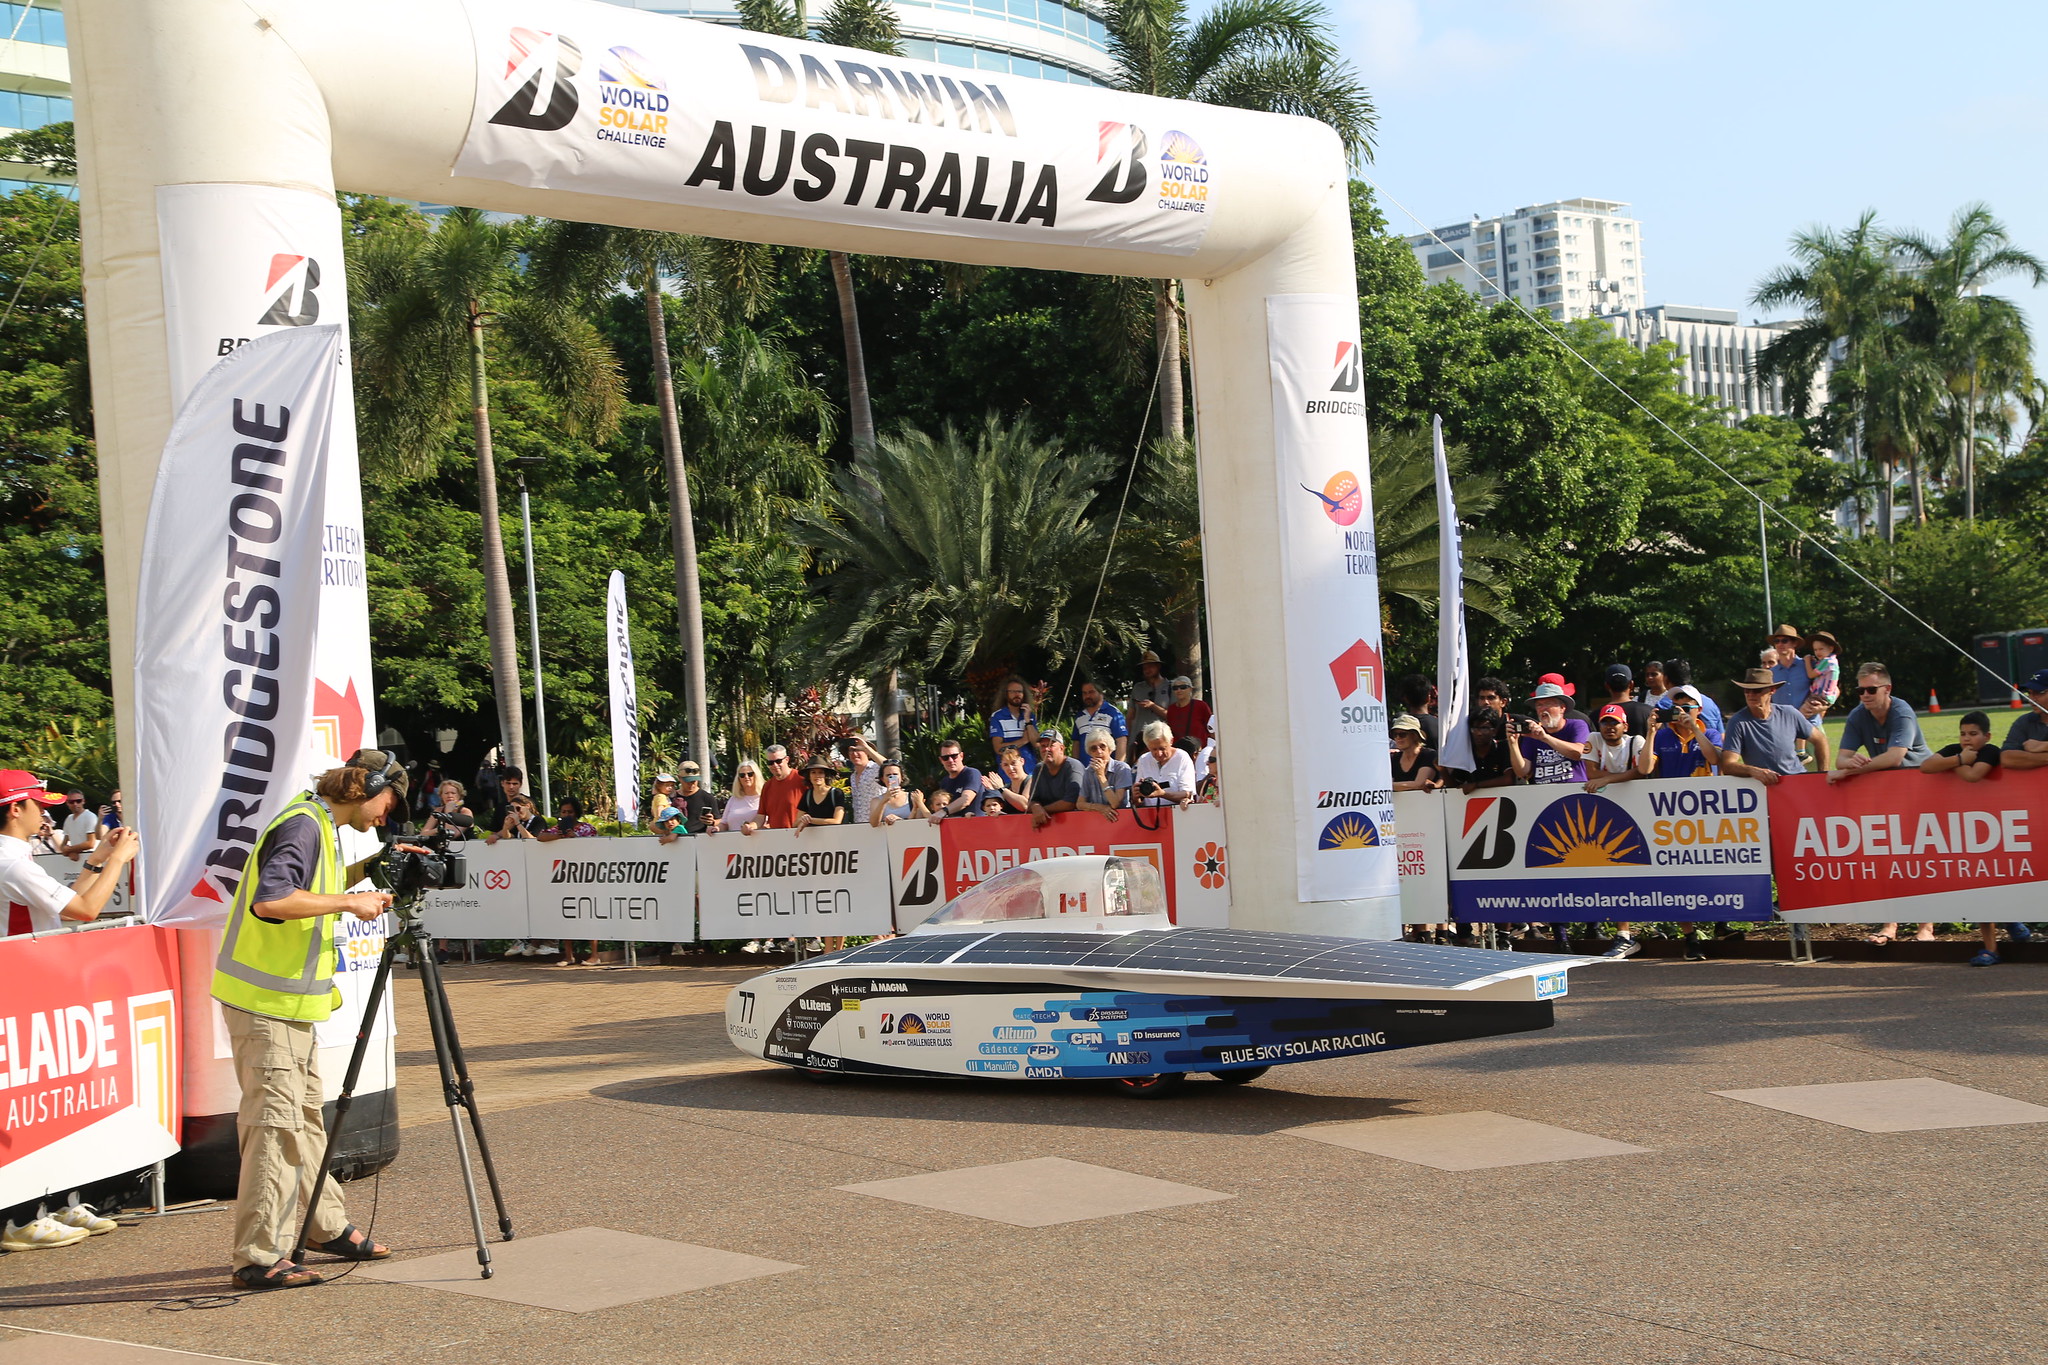
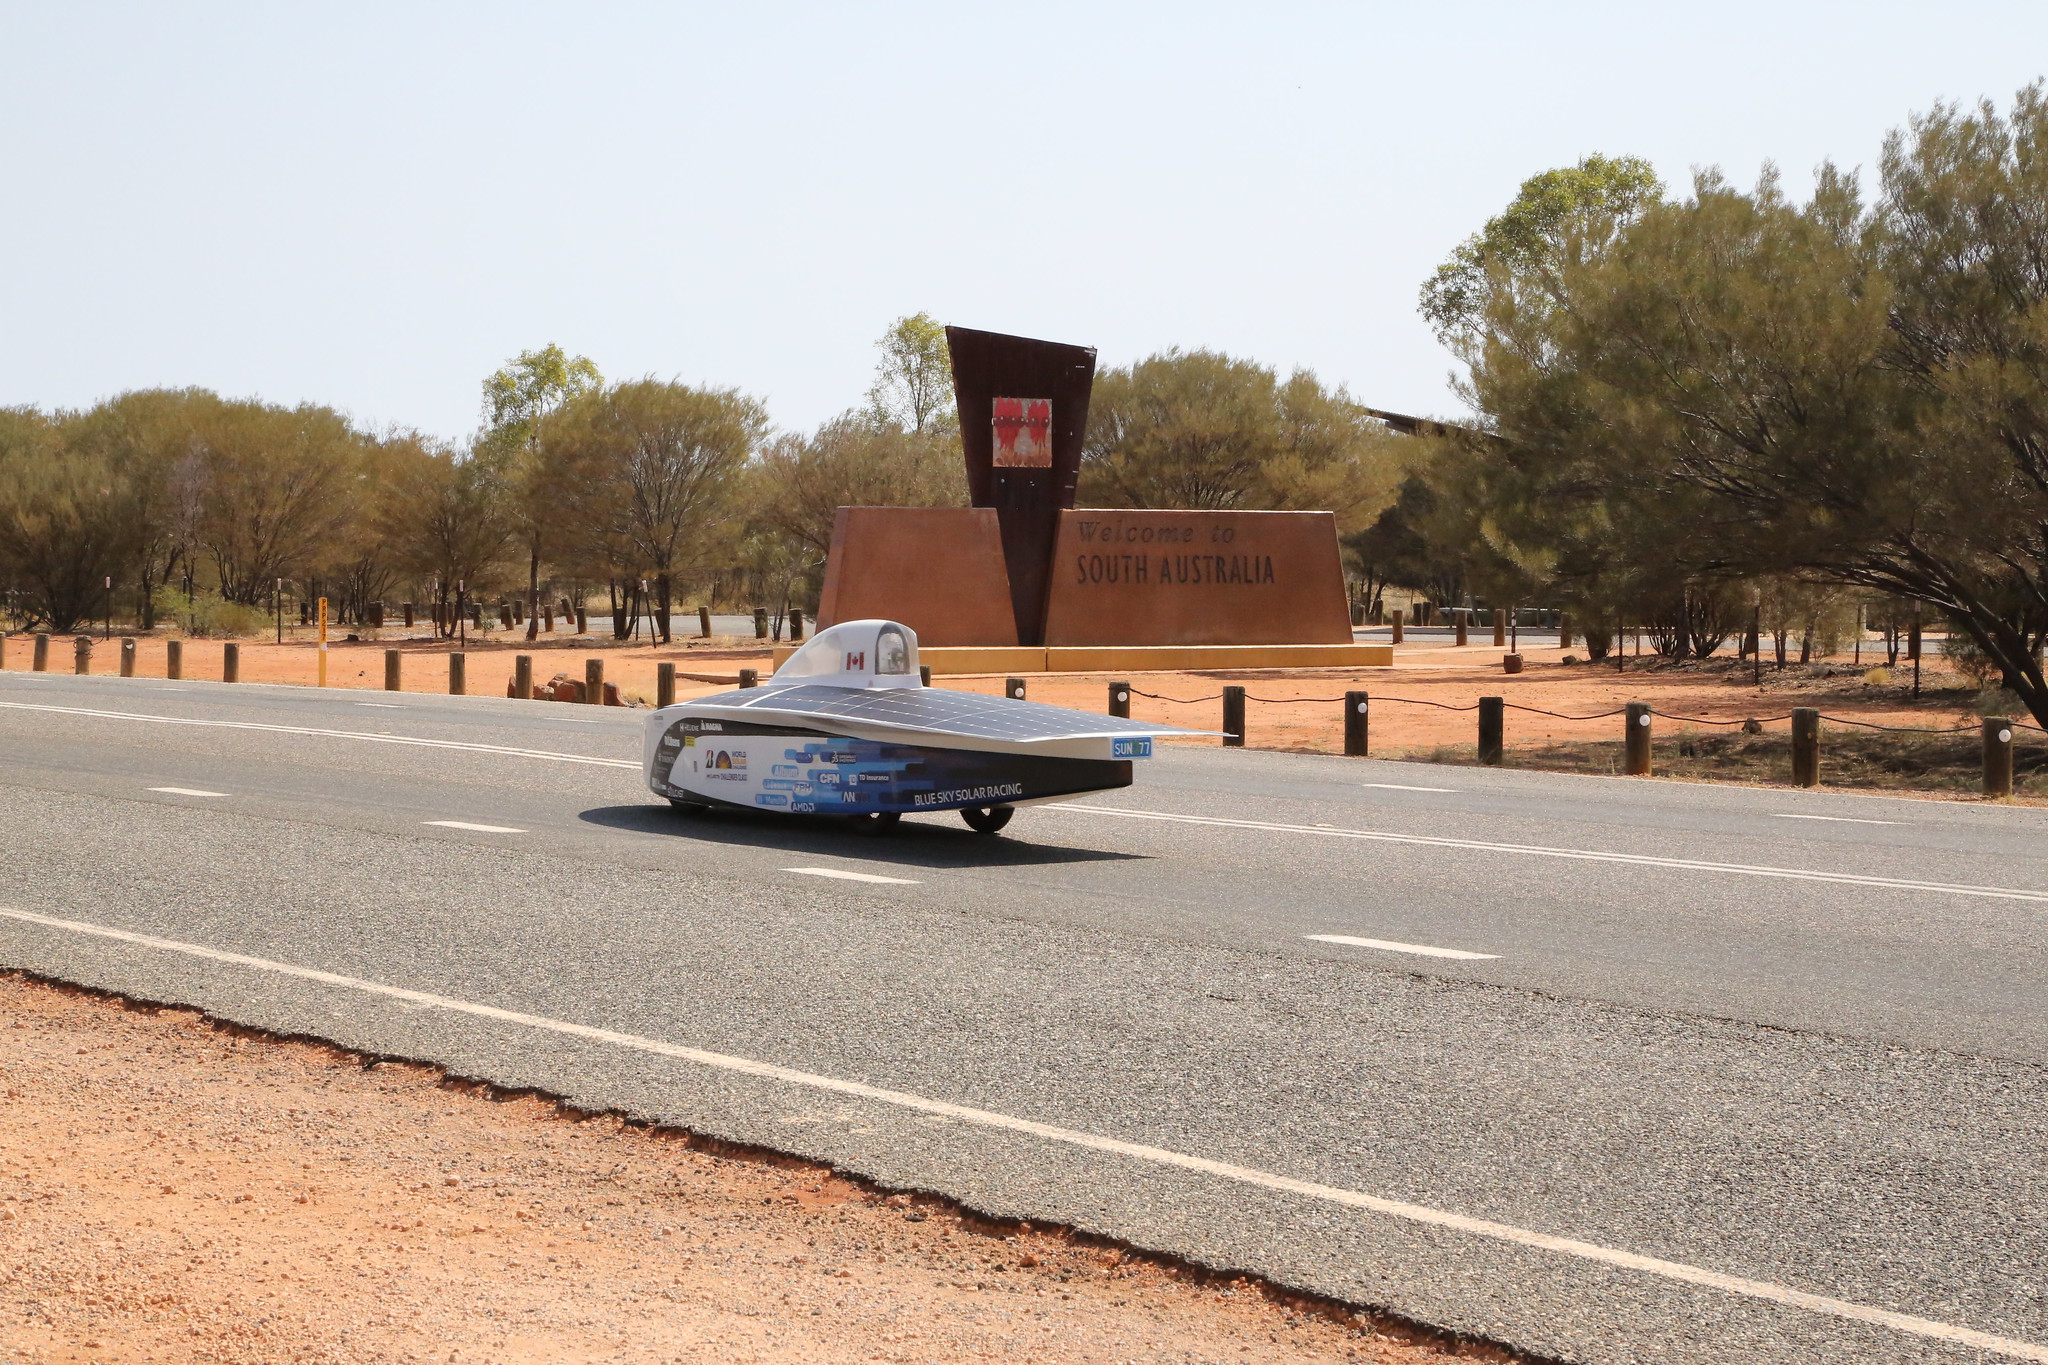
In early September, the team touched down in Australia. Following some logistical arrangements, the team immediately set to work reassembling and fine-tuning the solar car in preparation for testing. Over the course of several weeks, rigorous testing took place in Australia. The car effortlessly cleared both static and dynamic scrutineering processes. Finally, on October 22nd, the race commenced from Darwin, with the start line positioned at Parliament House in Darwin.
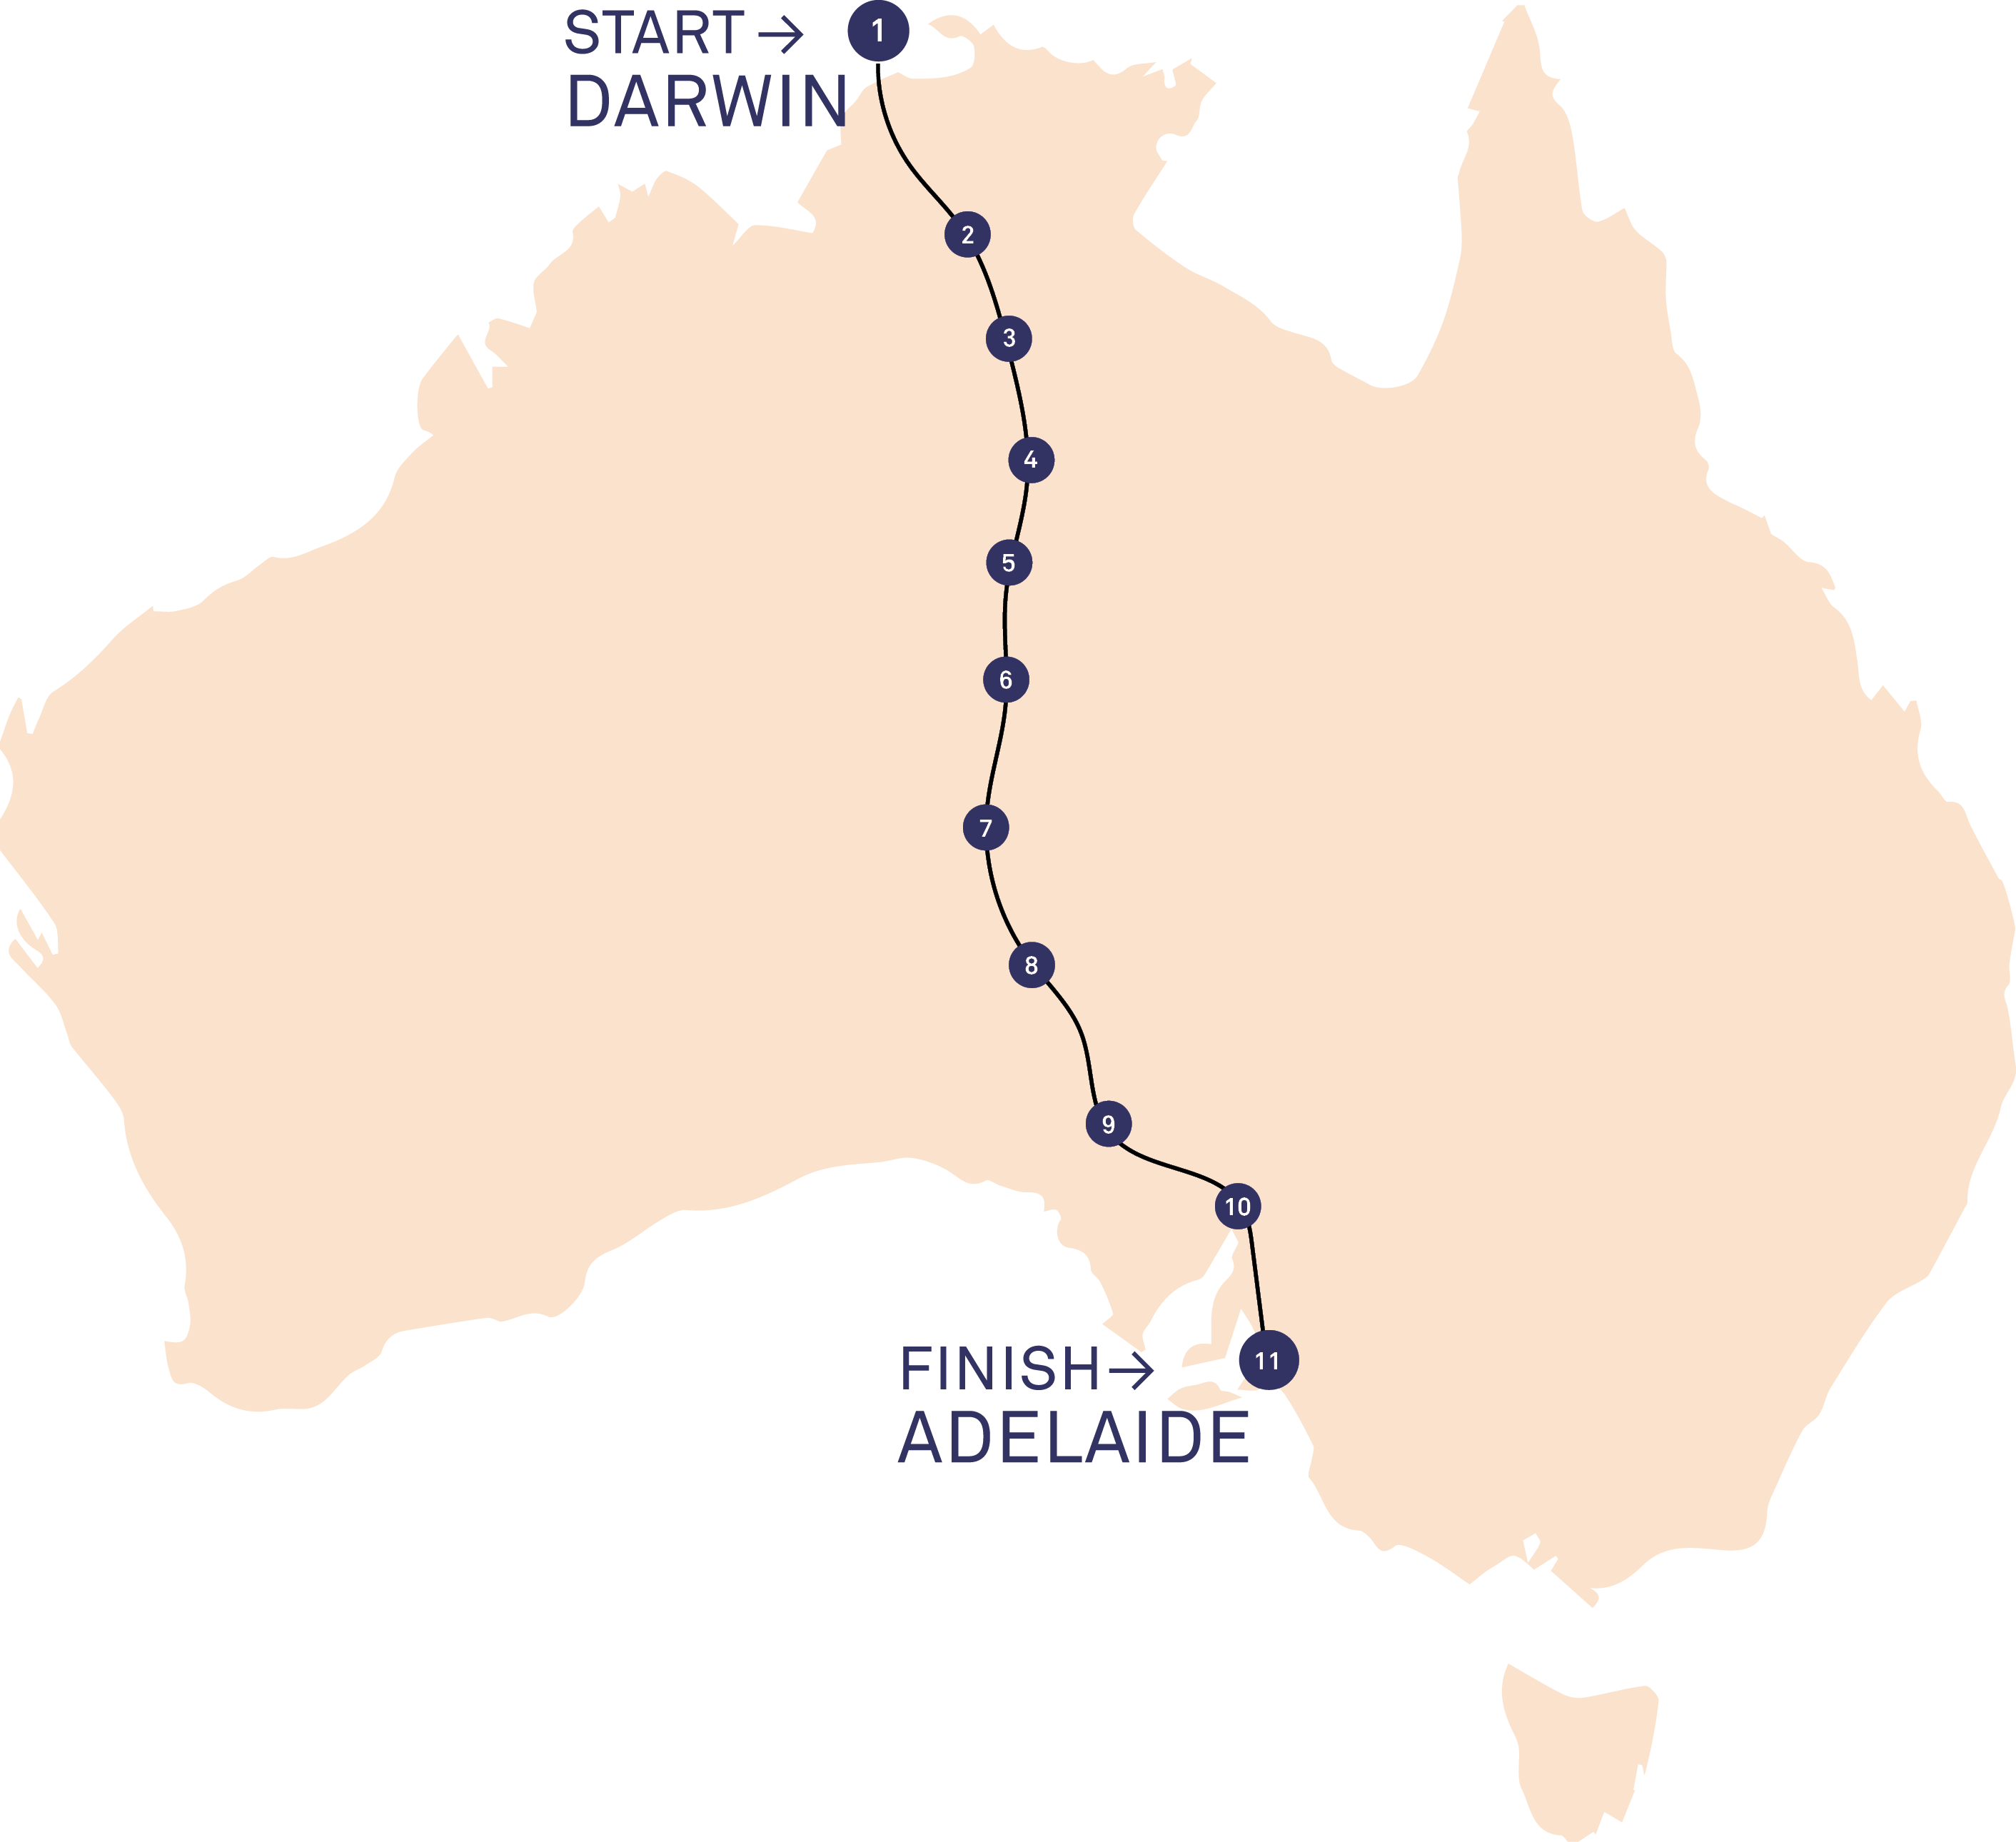
The solar car drove for 6 days, 9 hours a day. Each day started at 8:00 AM for all the teams and finished at 5:00 PM. The team prepared the solar car each day for charging from sunrise to the start of the day at 8:00 AM, likewise when the ended at 5:00 PM to sunset. There were stops along the route, called “Control Stops”, where teams were required to stop for 30 minutes and record their arrival time as well as change drivers and charge the car.
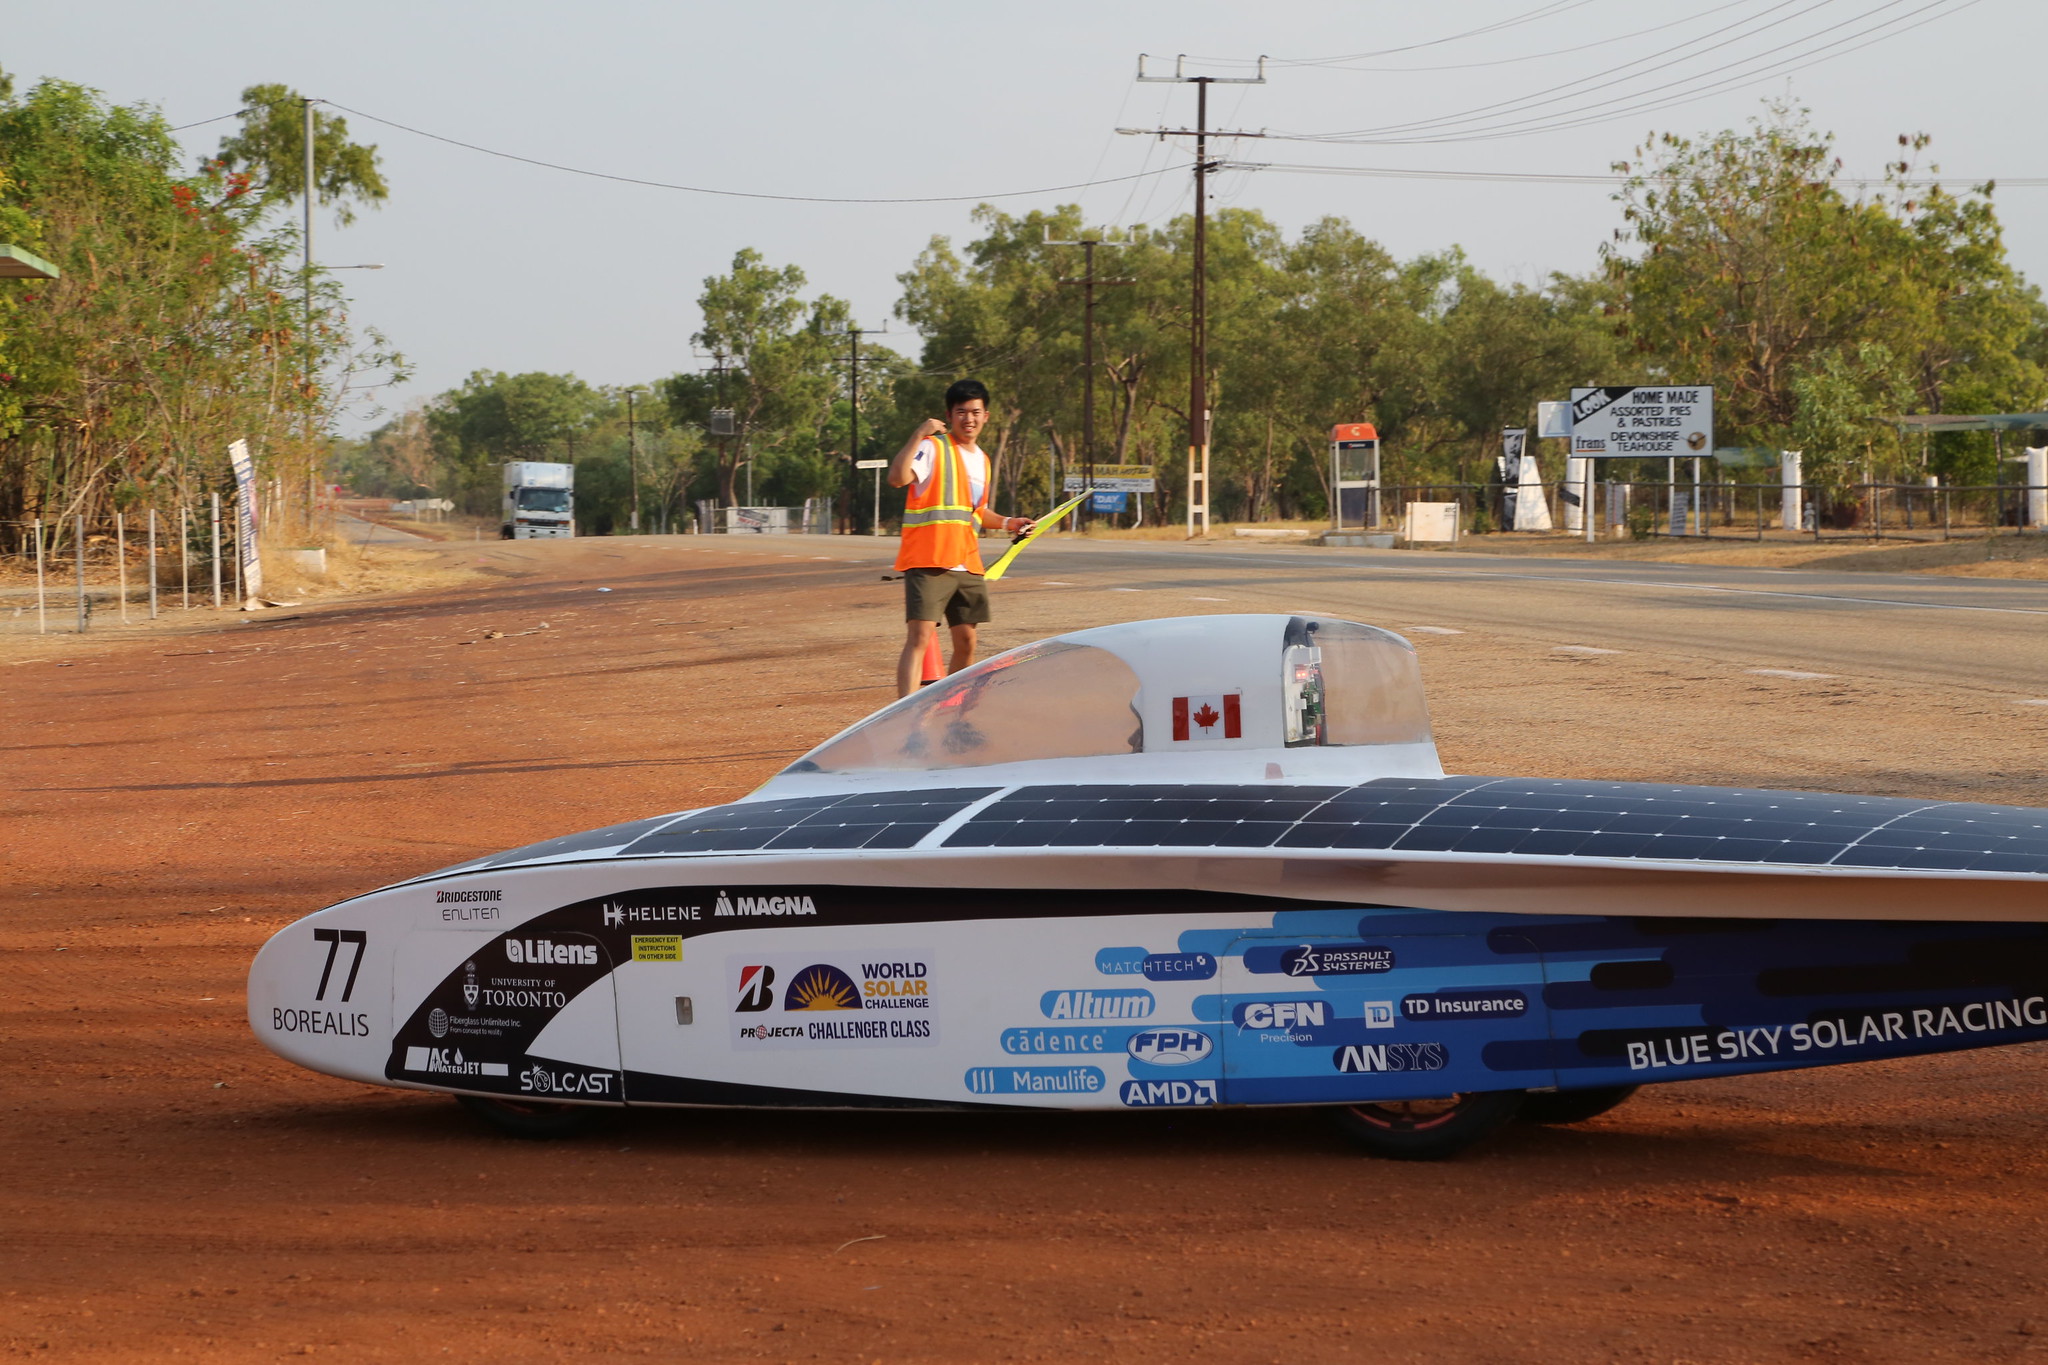
Day 1 ended quite successfully for our team. We were able to exit Darwin, known to be the hardest part of the route due to traffic congestion, without any breakdowns, in turn, we overtook many teams, including some highly competitive teams. The team reached the first control stop on day 1 and ended the day in a town called Larrimah, 500 Km outside of Darwin.
Day 2 ended at the fourth control stop, Tennanet Creek, 987 Km outside of Darwin. The day started quite well, however, as we faced major uphills, the motor began shutting down unexpectedly. Software improvements were made to fix the issue which was caused by communication loss between the motor controller and the battery. However, the motor did not stop giving us issues on the following day. Unfortunately, the motor caused us to go down 2 positions.
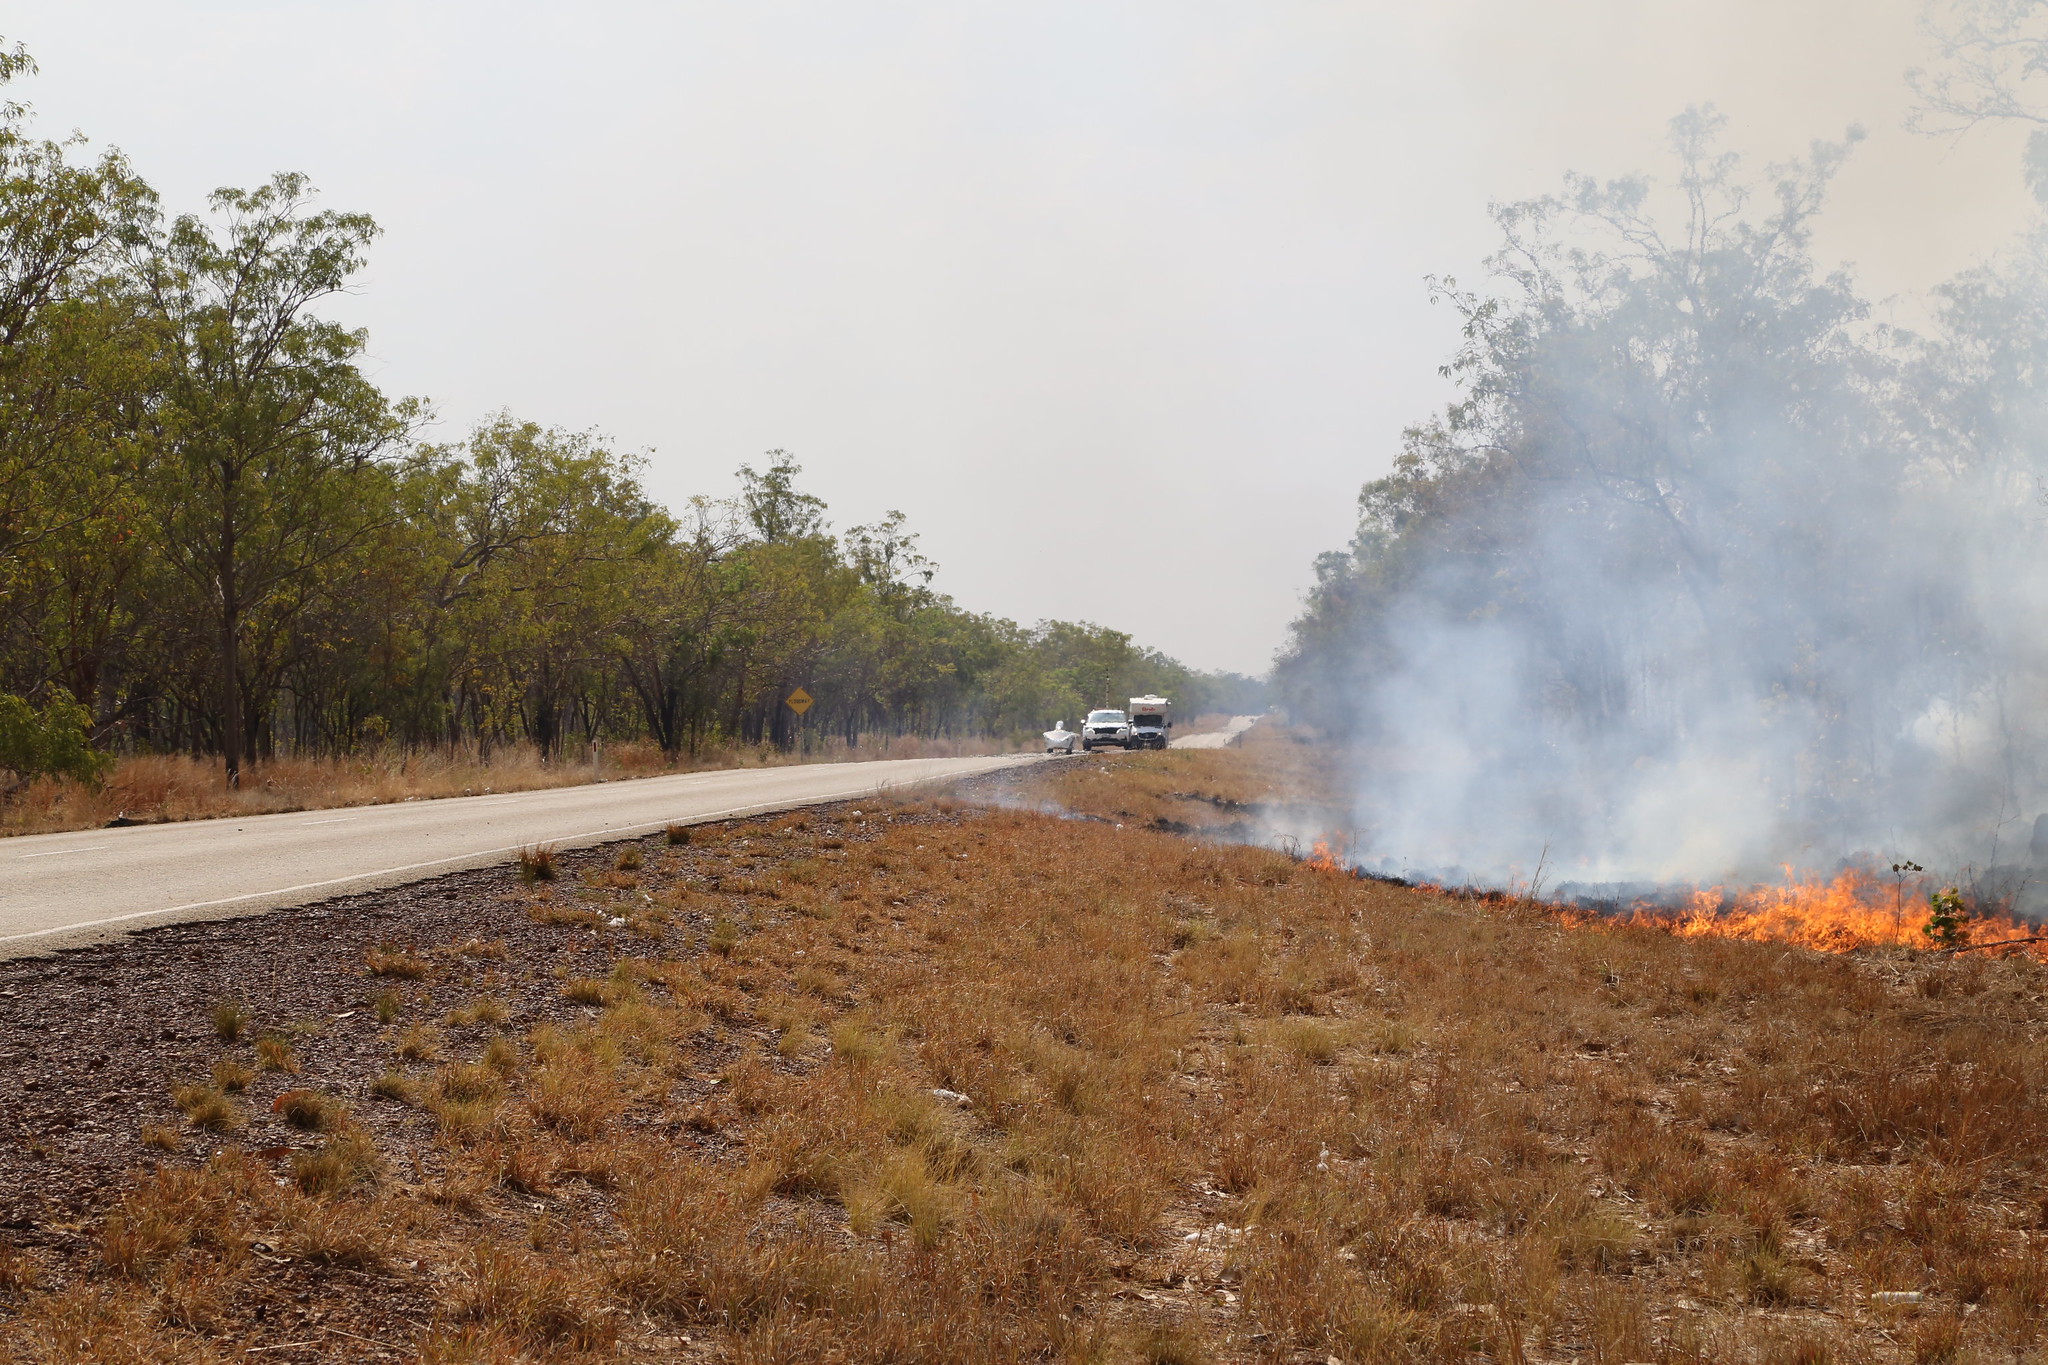

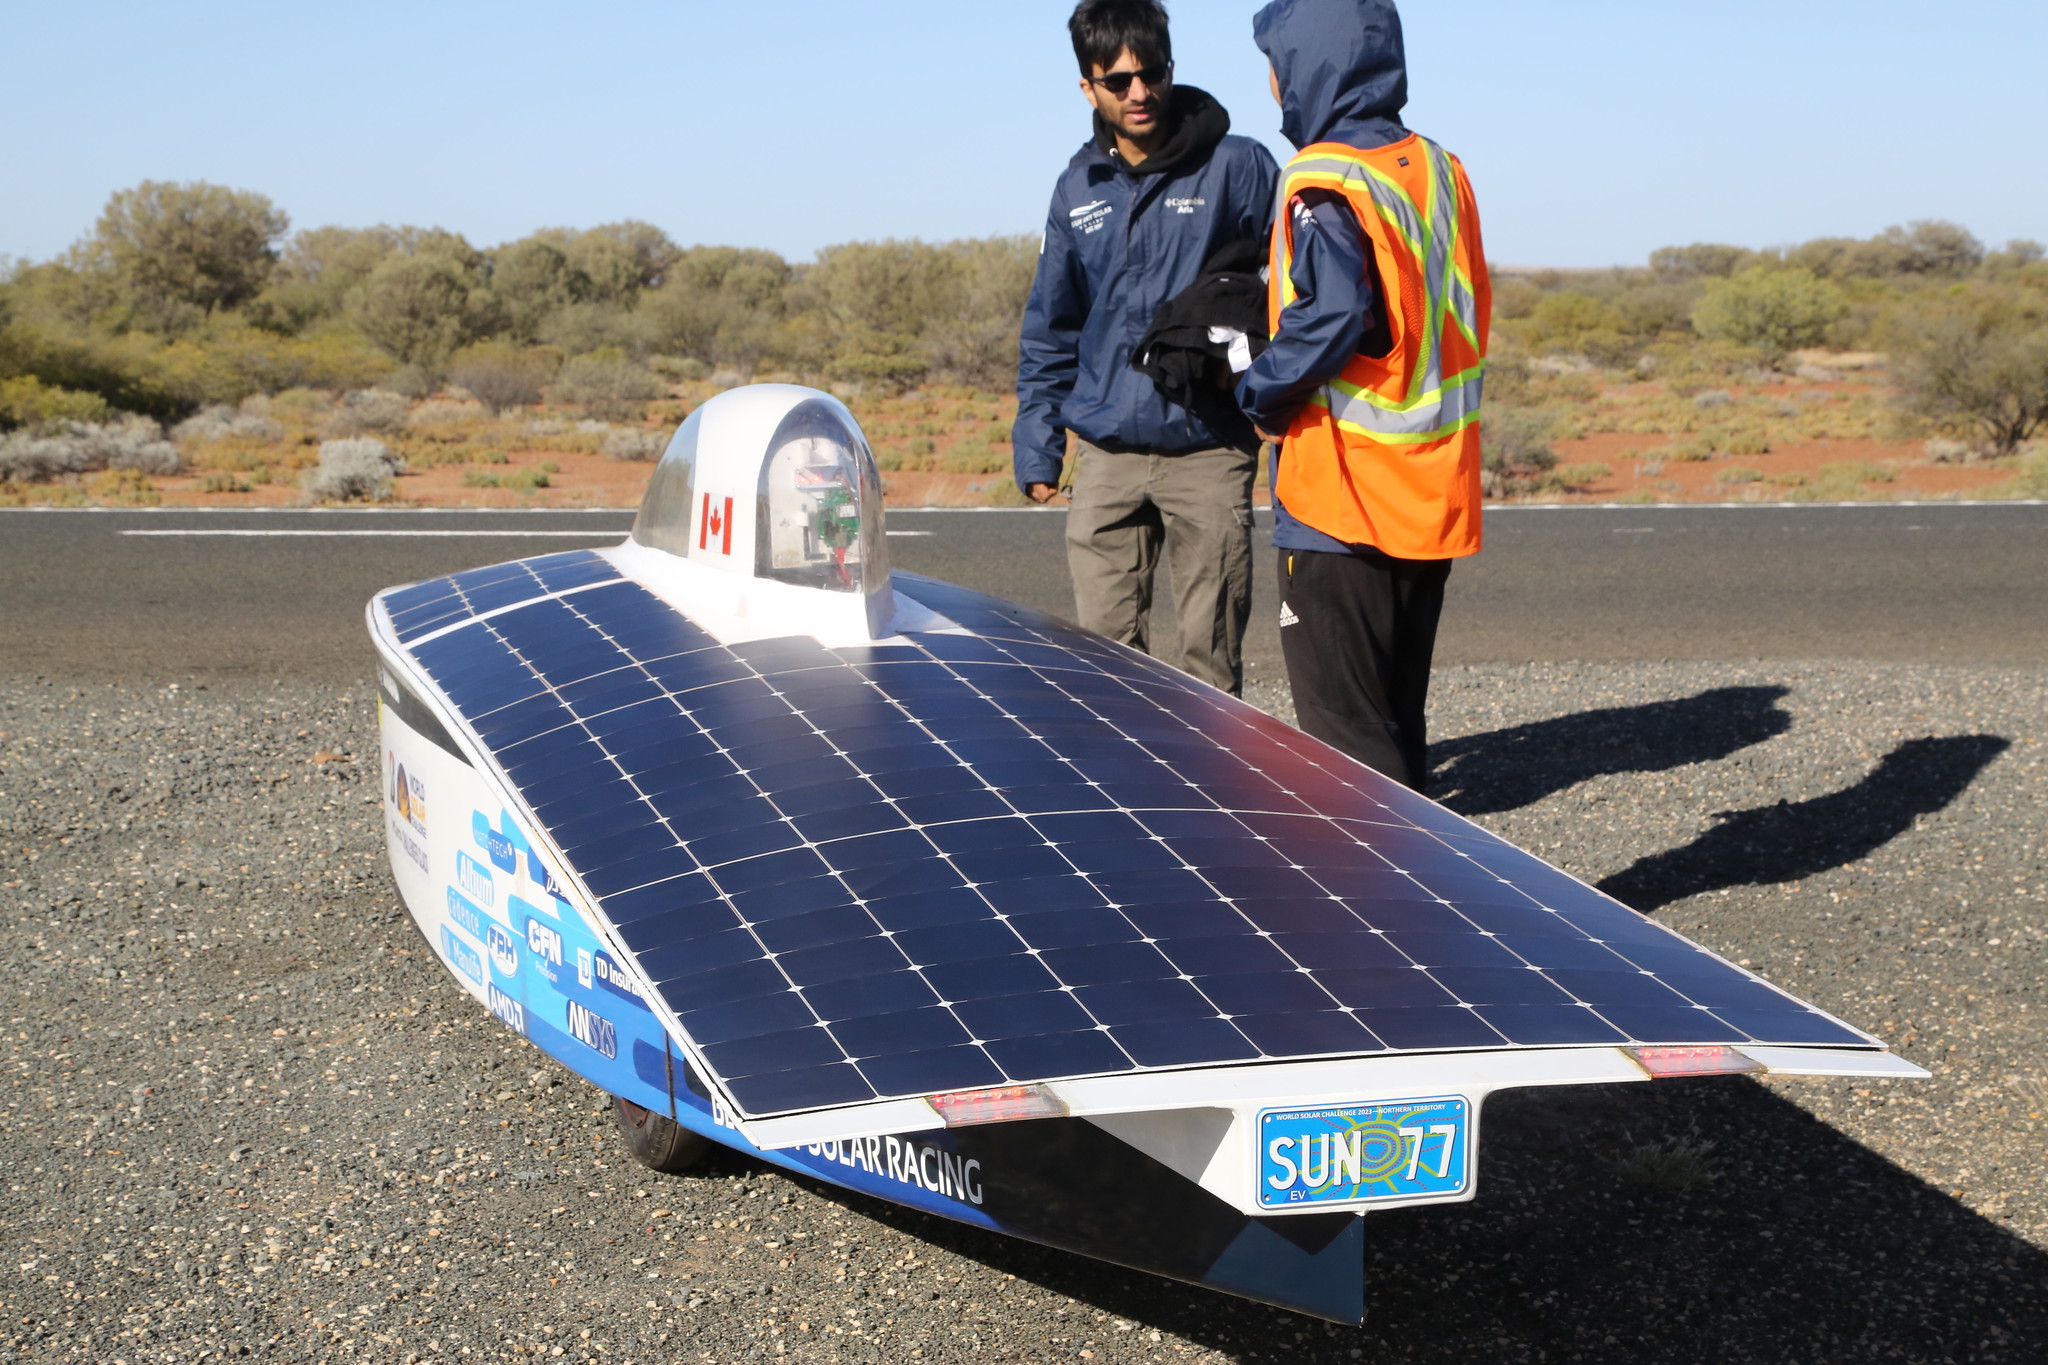
Day 3 ended just outside of Alice Springs, the sixth control, stop and 1493 Km outside Darwin, marking the halfway point of the route. The car proved to be quite reliable, however, the motor caused a 20-minute delay in the morning due to not starting. The motor was not able to start from stationary, we did not fully figure out the reason but we concluded the initial torque and the motor controller were the main issues. The motor controller was manufactured by a third party and our team did not have the familiarity to fix it. By the end of day 3, our battery’s state of charge was lower than we hoped for, the first three days we encountered forest fires and clouds that covered the sky for the whole day; on a sunny day we were able to hit 800 W - 900 W with our solar array, however, we were getting peak 500 W - 700 W.
Day 4 ended in Marla, 1951 Km outside of Darwin. During this day, we hit both control stops 7th (Erldunda) and 8th (Coober Pedy). At this point, the sky was clear and we were getting back 15% of our battery charge during the morning and evening charges. However, by the end of day 4 our state of charge was 7%, any amount of headwind or clouds could have seriously impacted us.
Day 5 ended just outside of Glendambo, 2380 Km outside of Darwin. By the end of day 5 our battery’s state of charge was 0%! During the evening charge, we were able to get 15% charge, however, we also had 620 Km left. We determined the weather on day 6 would decide if we could finish the race or not. Any amount of headwind or any cloud coverage would minimize our chance significantly.
During the morning of day 6, we were able to get our charge to 32%. Moreover, the day was quite clear and we were getting a good amount of power from the array. However, we had a small amount of headwind while we were hoping for a tailwind to increase our chance of reaching the finish line.
The day was quite stressful. We were trying to drive as efficiently as possible, but this was the same day when we were getting close to Adelaide, meaning a lot of traffic, construction, and heavy vehicles passing by. Every deceleration to 0 Km/h and back to our cruising speed would cause losing the equivalent of 15 minutes of driving time under normal conditions. Moreover, we were trying to drive above 70 Km/h to make sure we could cover the whole 620 km during the day because at 5:00 PM the race event would close; and also to make up for the times we lost due to our motor shutdowns and construction delays.
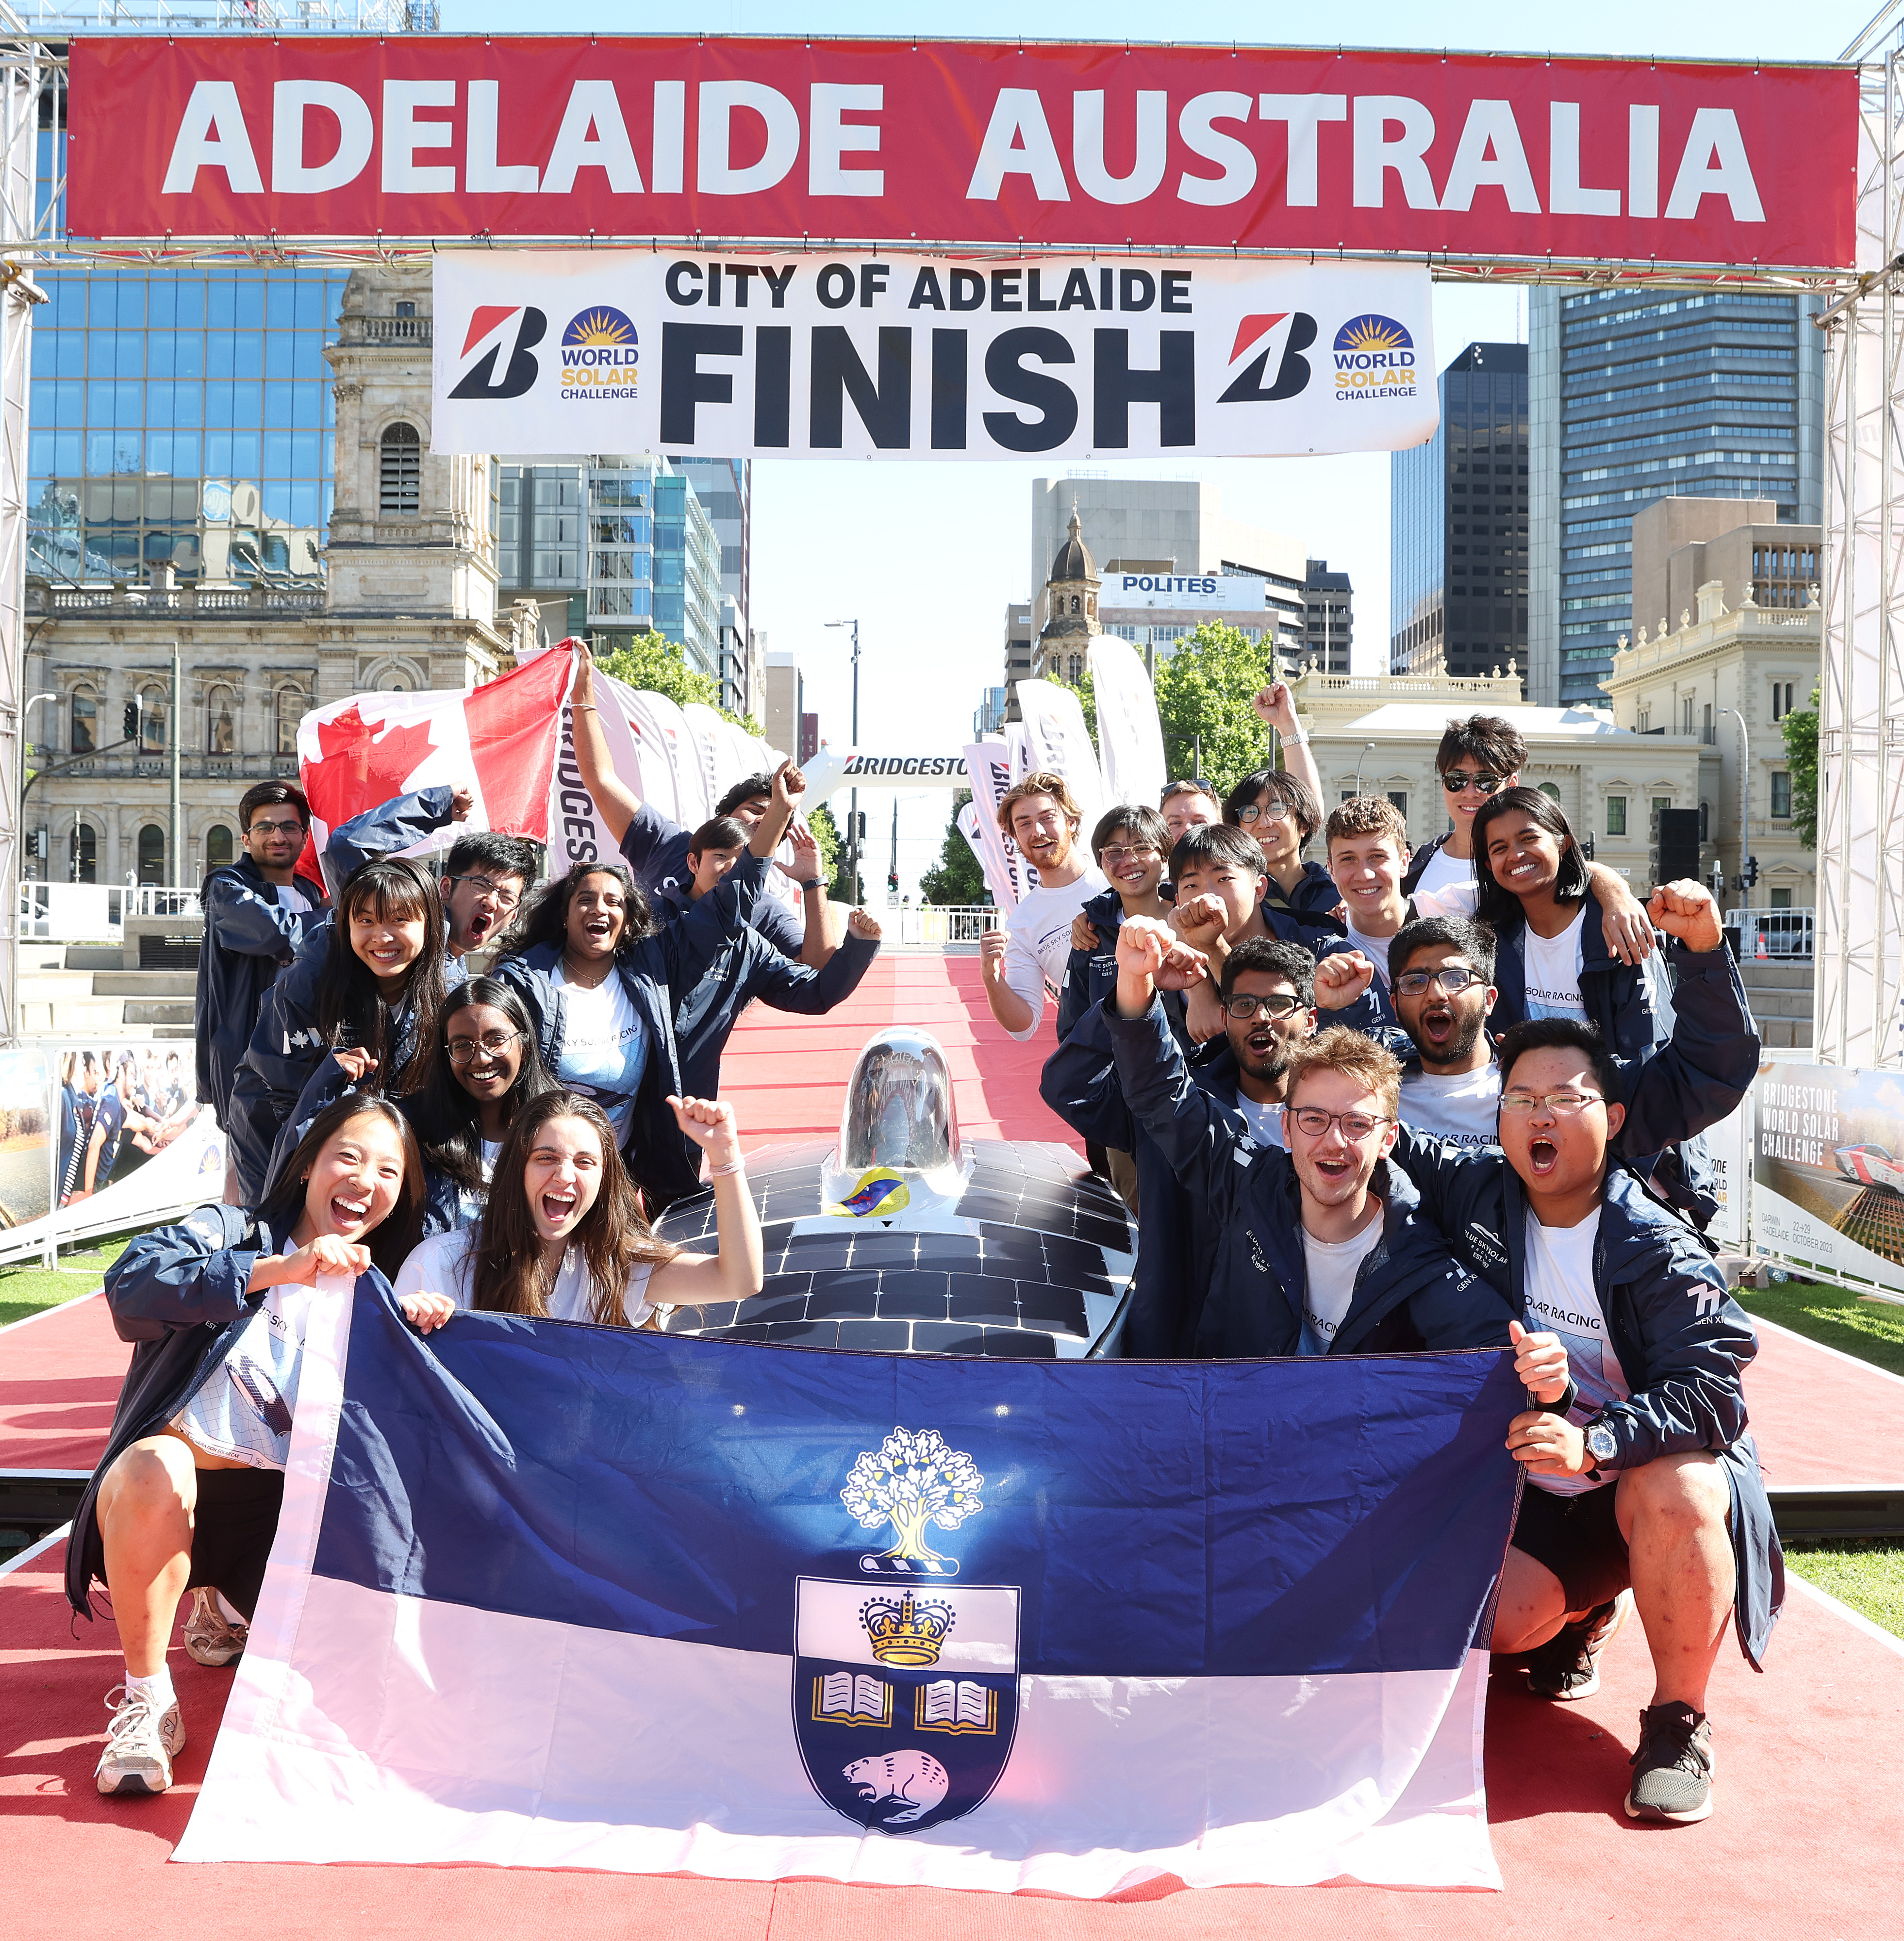
Finally, we reached Adelaide. 30 Km away from the finish line and driving for 2970 Km we made the tough decision of stopping. Driving any further would have caused the battery cell voltage to go below the manufacturer’s recommended minimum voltage, and risk a battery fire, which had happened in the 2019 race to another team. A battery fire would have seriously risked the driver’s safety and the team’s future.
I and all the members would have definitely been excited to reach the finish line. However, to me what mattered was reaching Adelaide. Crossing the continent in itself was a major success for the team, a team affected quite negatively by the pandemic. When I took over the Chief Engineer role, we had just pulled out of the American Solar Challenge 2022 race due to not being able to get the car ready on time because of the pandemic. Therefore, my main goal was to have a car race ready for the World Solar Challenge 2023.
We were not only able to participate but drove all the way to Adelaide, safely. This allowed the team to continue and start building the next solar car for the 2025 race, allowing future engineers to grow in this team just as I was able to grow in it. I started as a fabrication member not knowing anything about manufacturing, mechanical design, suspension, steering, kinematics, electrical design, carbon fiber, moulds and plugs, solar cells, aerodynamics, and so much more. Even skills outside of engineering such as leading a large team, organizing students, logistics, and driving a 20-feet trailer through downtown Toronto. I would have never expected to grow that much in two years, both technically and personally.
I am glad the next design cycle has already started. It is inspiring to see new students at the Blue Sky shop in the Annex building, brainstorming ideas for the next car. This shop was where I spent two years of my life, and now, it’s filled with unfamiliar faces. But I can sense our shared passion, a passion toward sustainability.
Mechanical
Forces on the Suspension and Chassis
Early in my role as chief engineer, I was able to validate the safety of the mechanical system though FEA simulations.
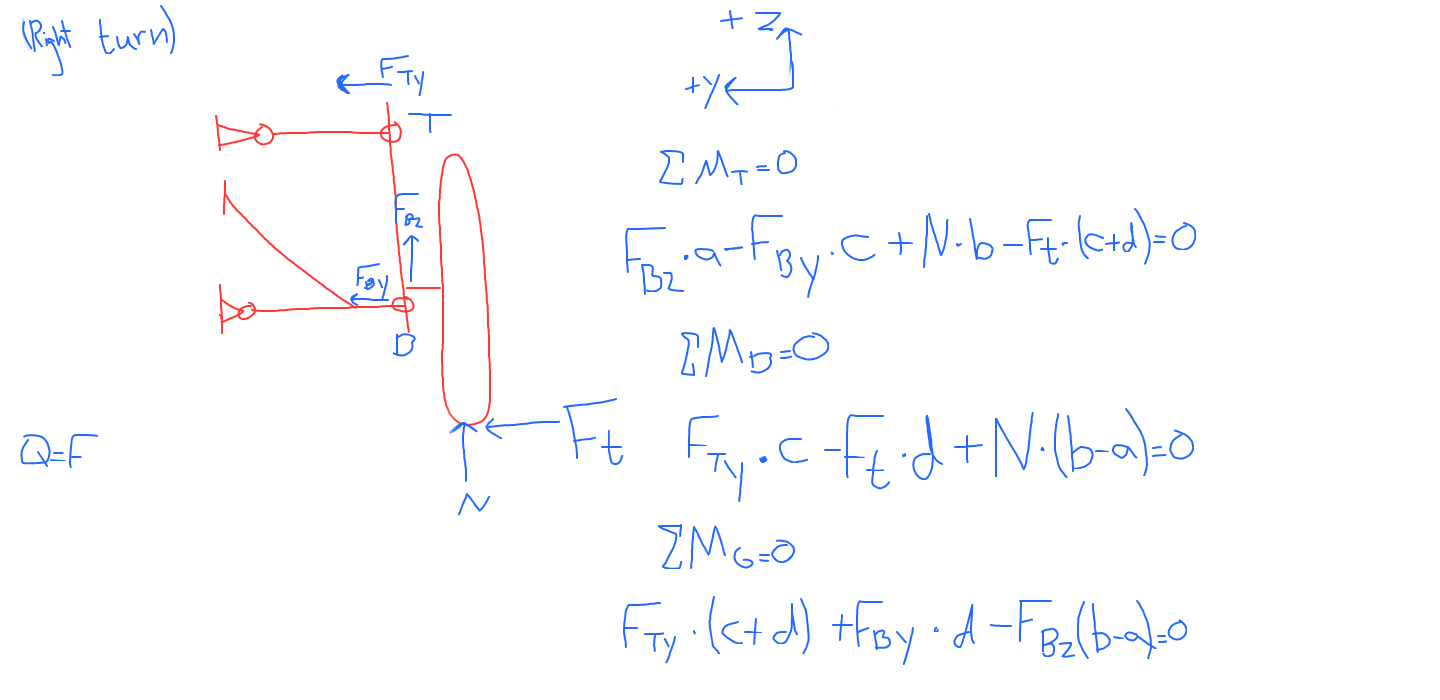
The forces on the suspension system were used for all mechanical and structural simulations to ensure the safety of the car in different scenarios. The scenarios included bumps, brakes, and turns for different accelerations. For example, a [2,1,1] case represents 2g acceleration for bump, 1g for brake, and 1g for turn.
The dynamic loads on each wheel were be calculated after finding the lateral and longitudinal weight transfer for different scenarios. These loads were applied to the wheel and using force body diagrams, we can calculate the forces on the mechanical components such as the lower control arm, upright, and upper control arm for our solar car.
Spring rates, Preload, and Shocks
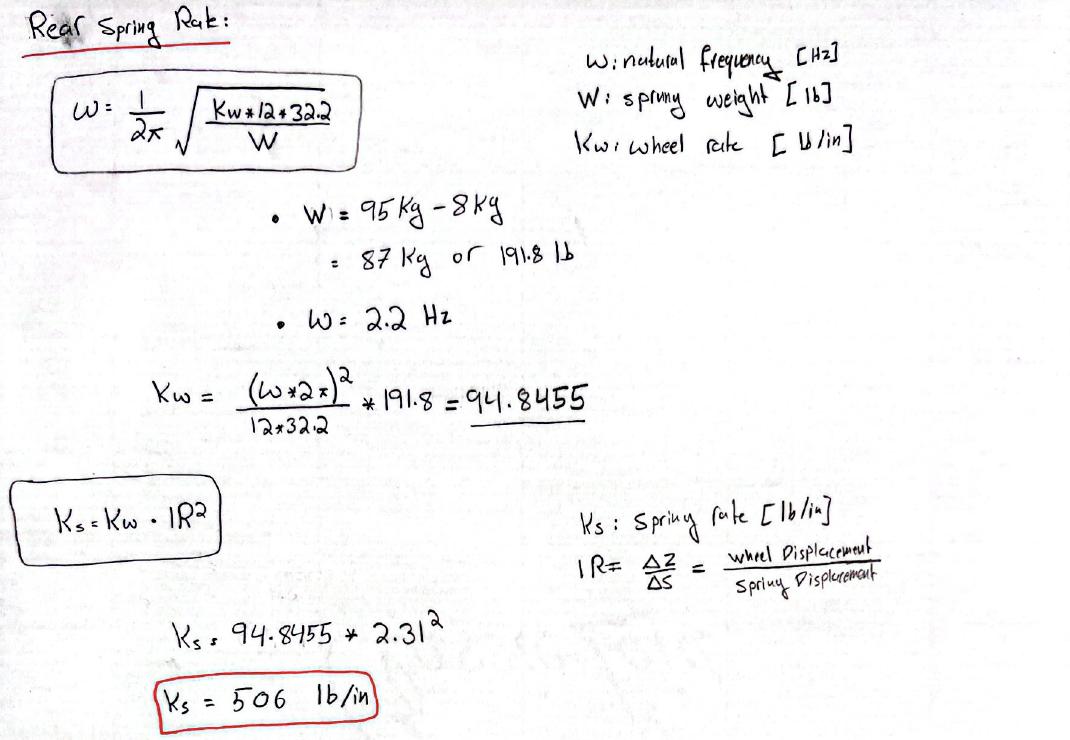
I had the oppurtunity to choose the shocks and springs of the solar car. Choosing proper shocks and springs is vital for the safety of the car and the comfort of the driver. Shocks need to have the correct stroke length allowing the full bump and droop travel of the wheels.
Proper springs are required for the correct ride height, comfort, and stability of the car; preload needs to be calculated to achieve the correct ride height for that particular spring. Given the unique dynamics of our vehicle, it necessitated the custom manufacturing of springs tailored to its requirements.
The table below shows the front spring parameters. The length of the spring and low spring rate required a custom manufactured spring.
| Parameter | Value | Unit |
|---|---|---|
| Extended Length | 250 | mm |
| Natural Length | 227 | mm |
| Compressed Length | 201.5 | mm |
| Stroke | 75 | mm |
| Bump Travel | 50 | mm |
| Droop Travel | 50 | mm |
| Natural Frequency | 1.5 | Hz |
| Installation Ratio | 1.96 | - |
| Spring rate | 127 | lb/in |
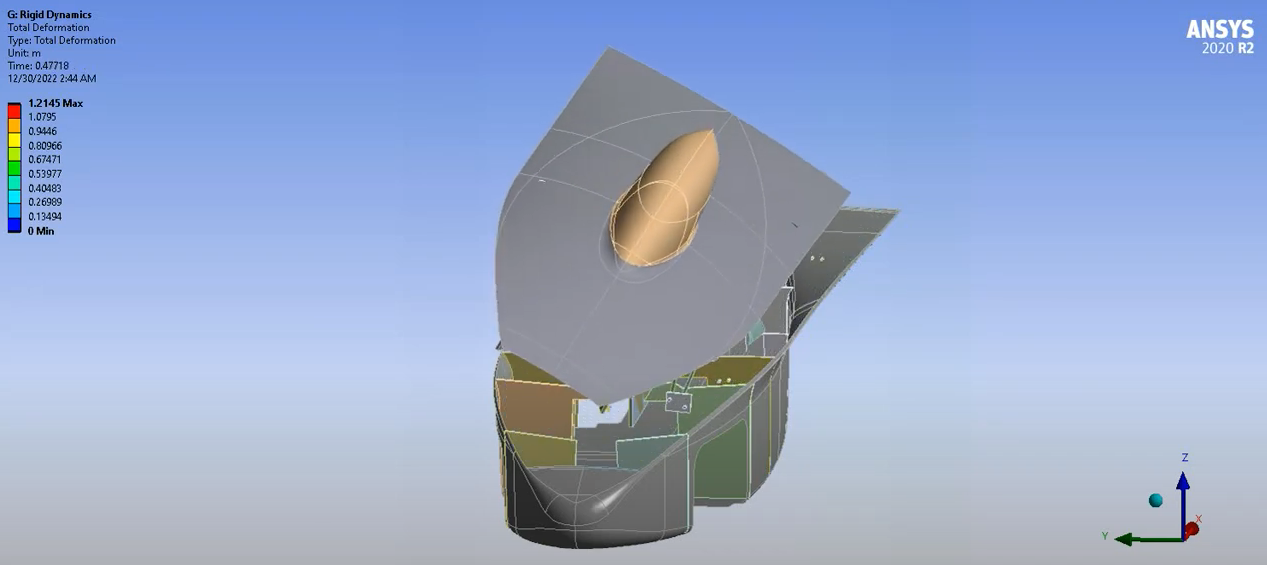
Ansys Transient Analysis
The solar car’s top shell needed to be opened for the driver to exit the car and the array to be orthogonal to the sun during charging. Utilizing Ansys, I was able to analyze the four-bar mechanism used to open and close the top shell.
 https://www.youtube.com/watch?v=_3VnMIyA7GE
Structural and Fabrication
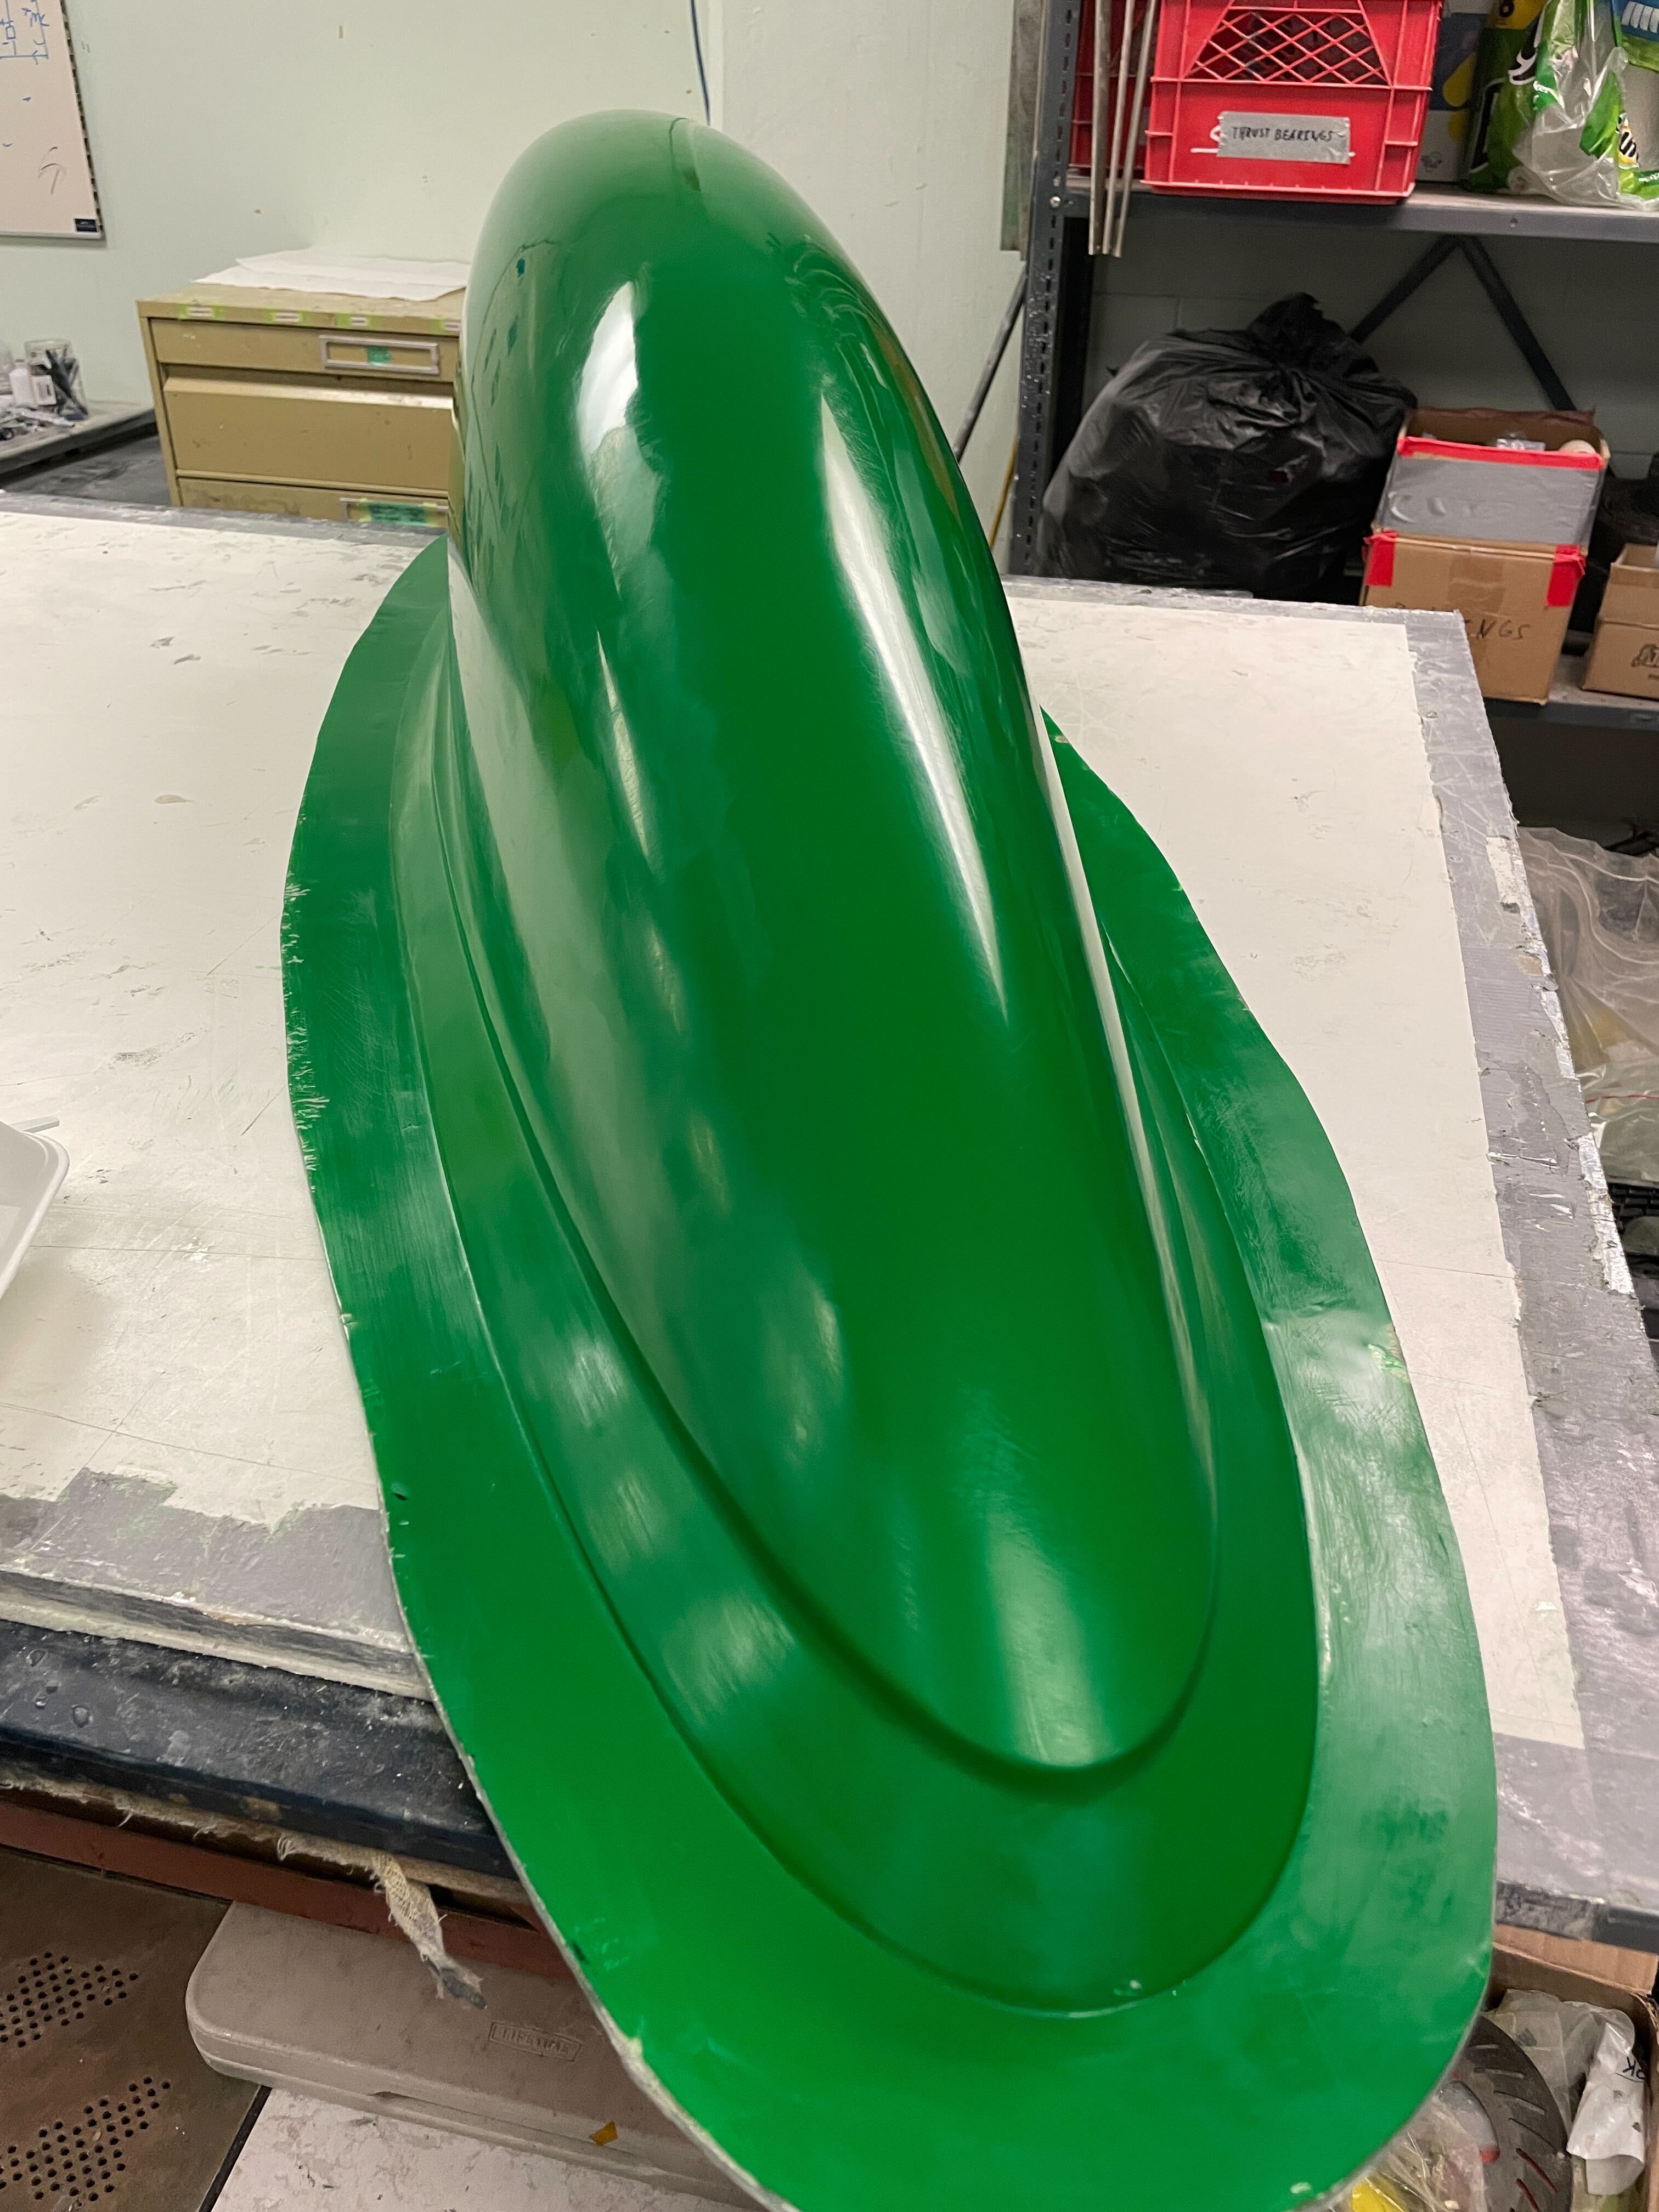
Canopy
The canopy pattern was made with polyurethance tooling boards and CNC machined with one our sponsors. Later, a gelcoat layer (the green color in the image below) is spray painted on the post-processed tooling board which has been sanded and primered. Next, polyester resin and fiberglass is used to create the mould. Finally, the gelcoat layer is further sanded to very high grit for maximum clarity.
We were able to improve the clarity of the canopy segnificantly. The canopy was manufactured through thermoforming a 1/8” PETG sheet onto the fiberglass mould.
As with any other manufacturing process, communication is always the key with experts. For example, the shape of the mould below was determined based on several parameters such as location of the cutline, location of the vacuum holes, and the flange as mounting point.
https://youtu.be/w0_8egBI3Bk
The link above shows an older thermoforming process we performed on a tooling board directly, which was a mistake due to tooling boards absorbing moisture and while thermoforming, the moisture evaporates and creates bubbles in the final product.
Top Shell
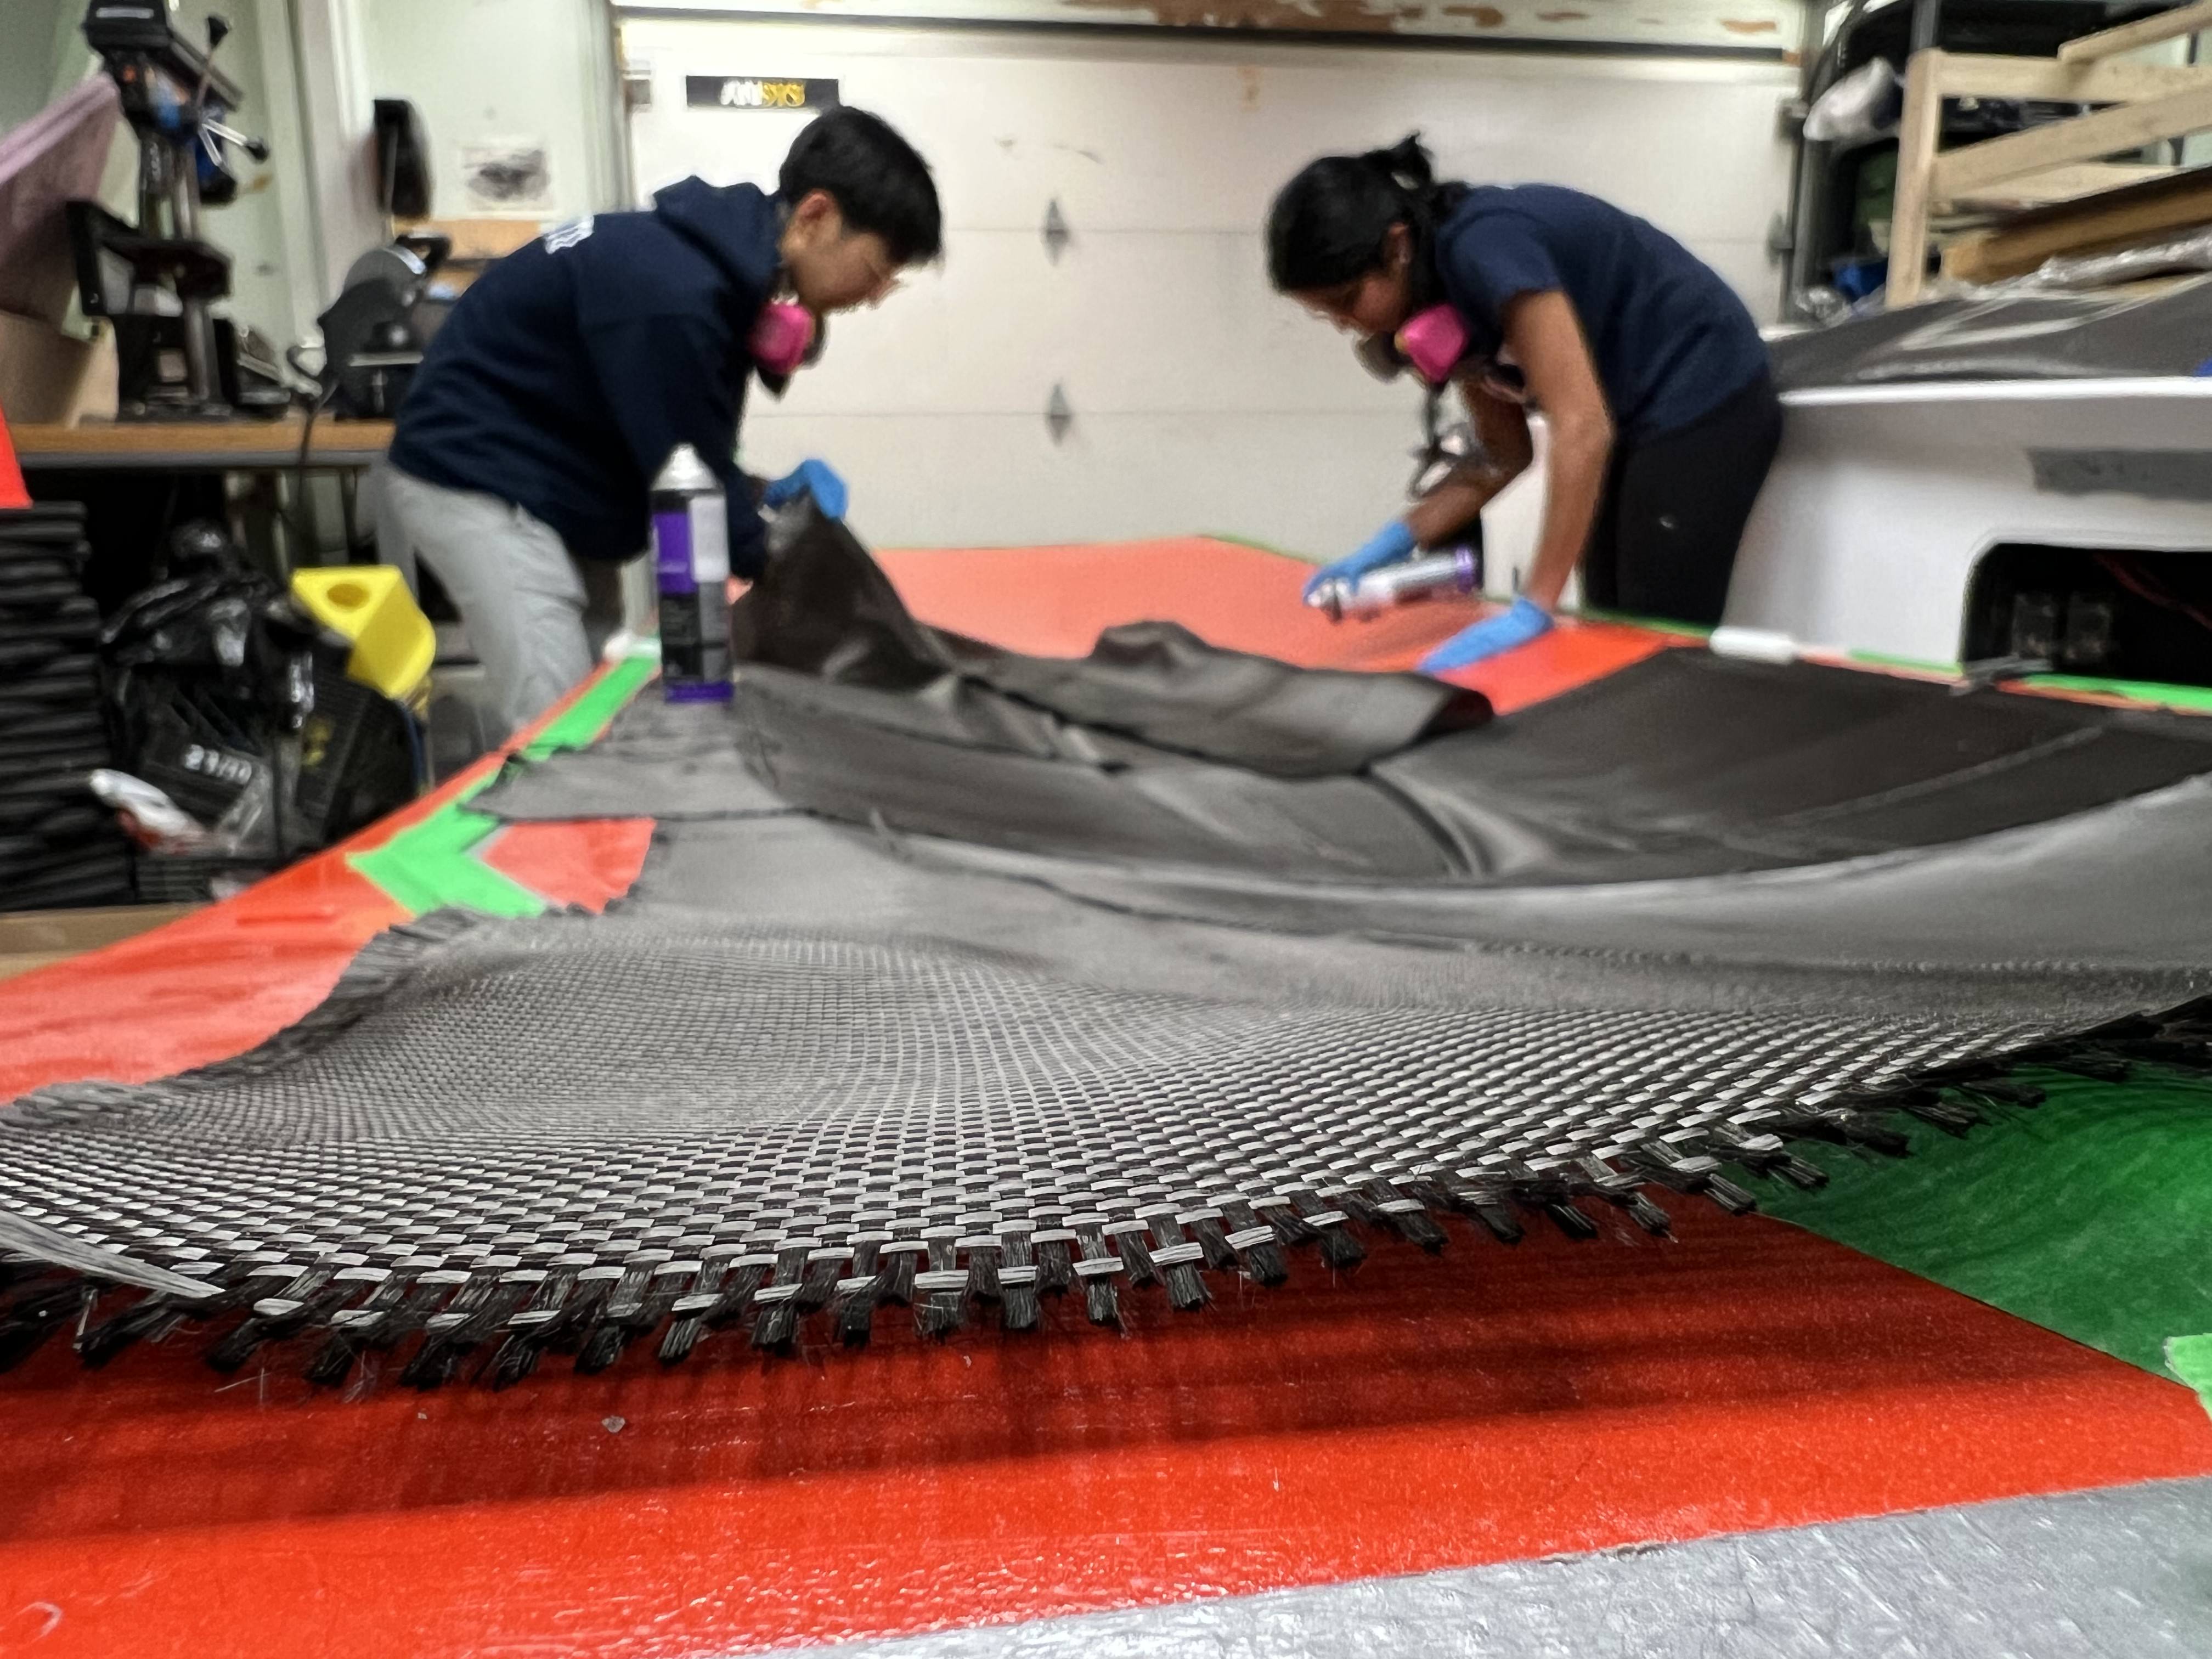
The top shell of the solar car was manufactured through a resin-infusion process. Previously our team has been fortunate to use Bombardier’s autoclave within their C series program. However, the pandemic unfortunately terminated that option. Therefore, we dialed to resin-infusion, a process no member or even alumni was familiar with.
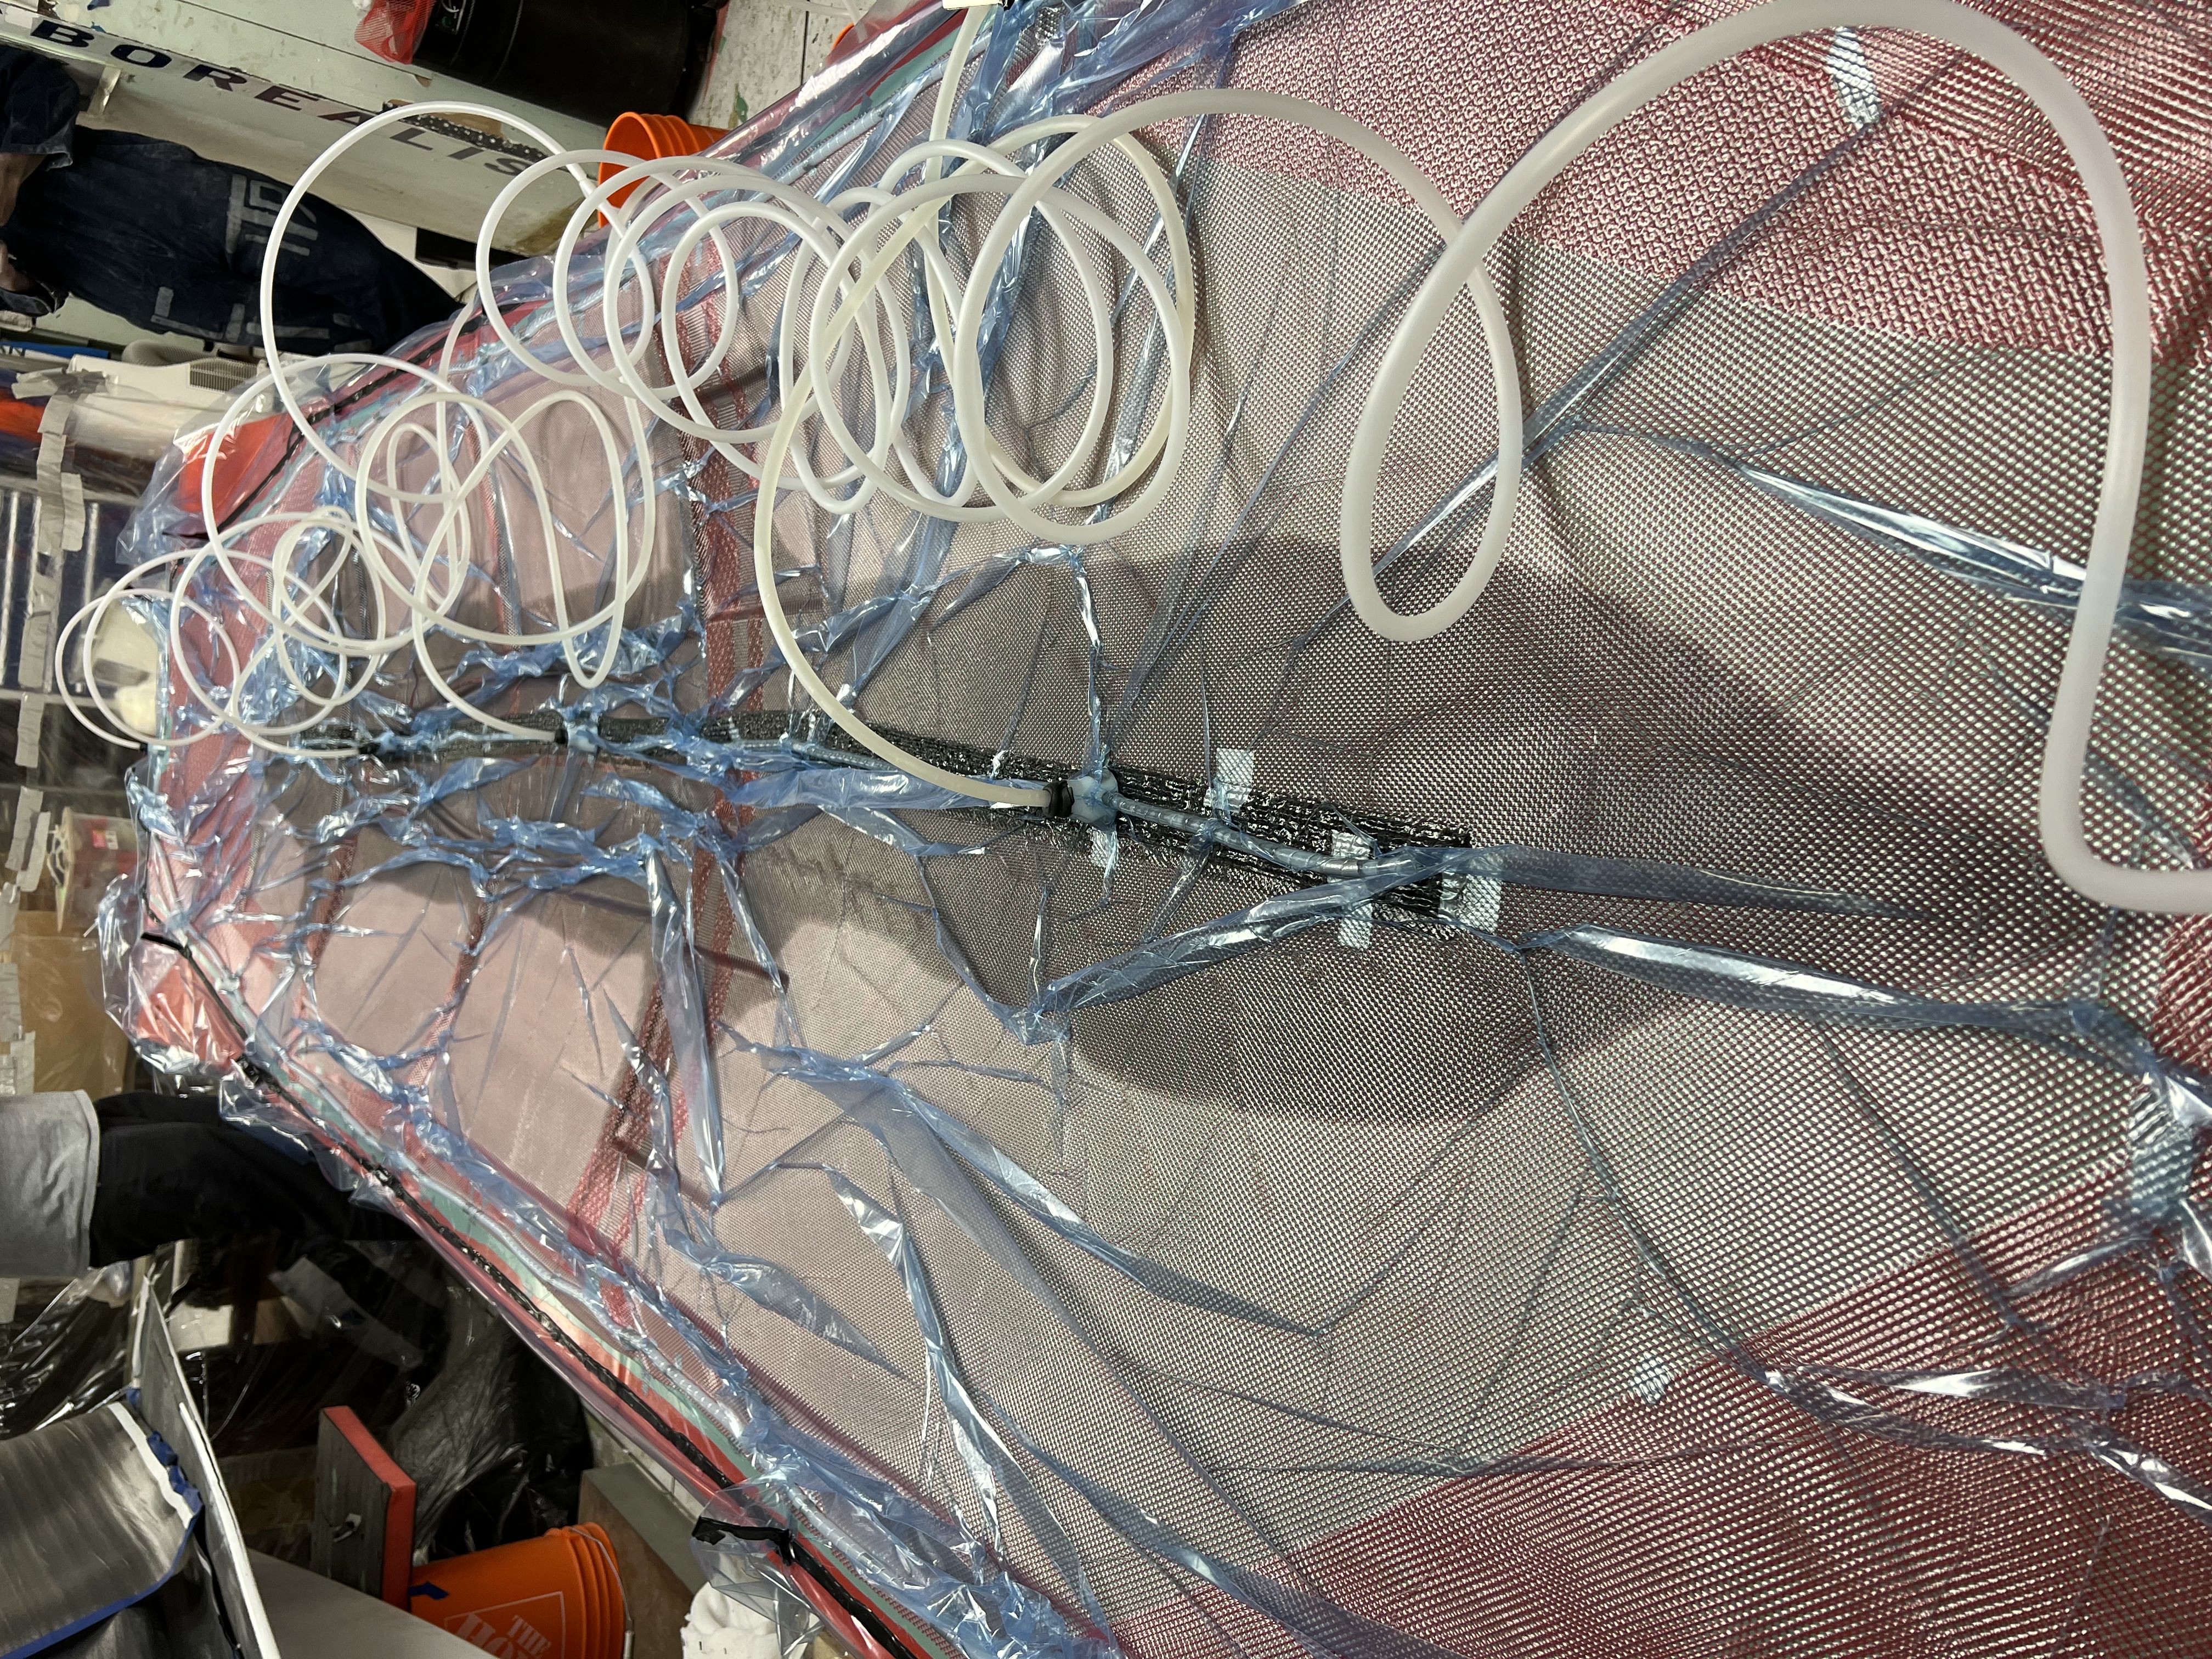
Despite this unfamiliarity, we successfully executed the resin-infusion process. Resin-infusion is all about preperation. The actual infusion of resin typically spans 1-2 hours, depending on the viscosity of the resin and the complexity of the part’s shape. The initial image illustrates the first layer of carbon fiber laid on the mold using spray adhesive, with utmost care to prevent wrinkles. Subsequent layers of carbon are added alongside the foam core (Divinycell). The second image showcases the resin-infusion phase: the resin flows into the mold’s center via tubes and, upon reaching the mold’s periphery, enters exit tubes connected to a vacuum.
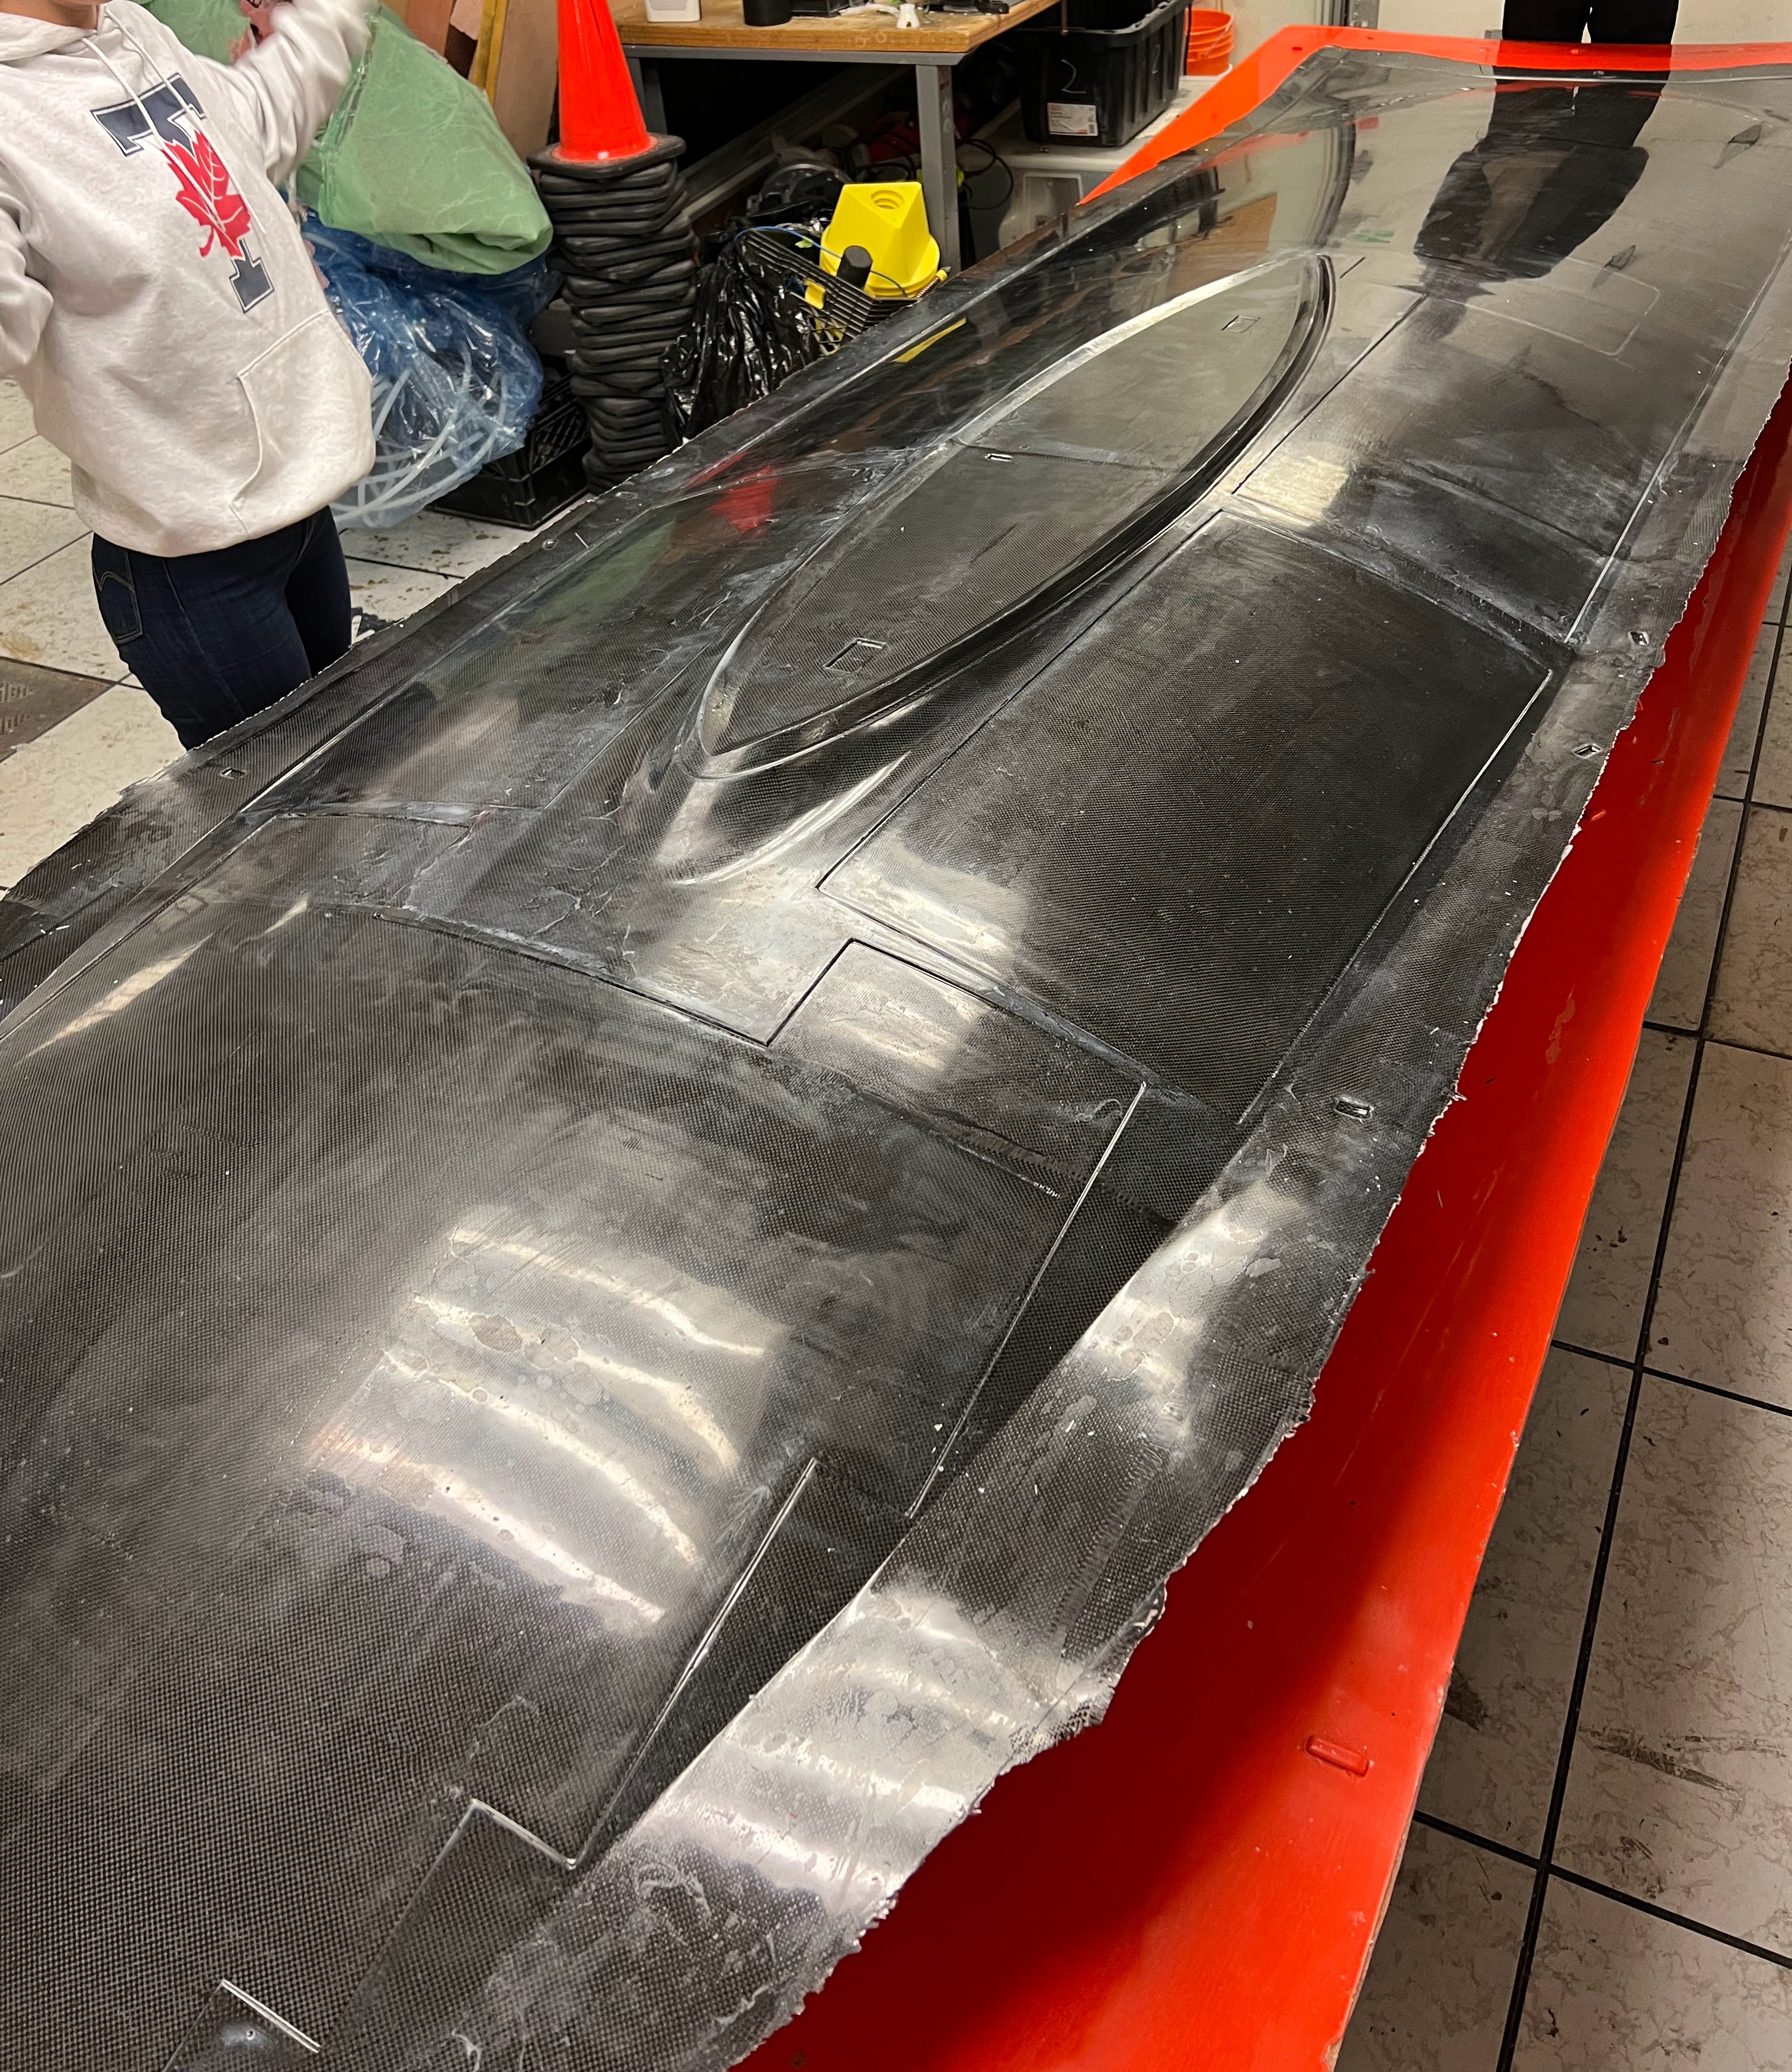
The final image captures the moment when we successfully removed the part from the mold. This is the most exiting part of the whole manufacturing process, all the work going back to plug, machining, days of sanding, fiberglass mould, and post-processing results in an actual part for the solar car. Manufacturing is indeed eye opening.
“Understaning manufacturing as an engineer, gives you utmost respect from technicians” - A manufacturing sponsor
Testing of the Solar Car
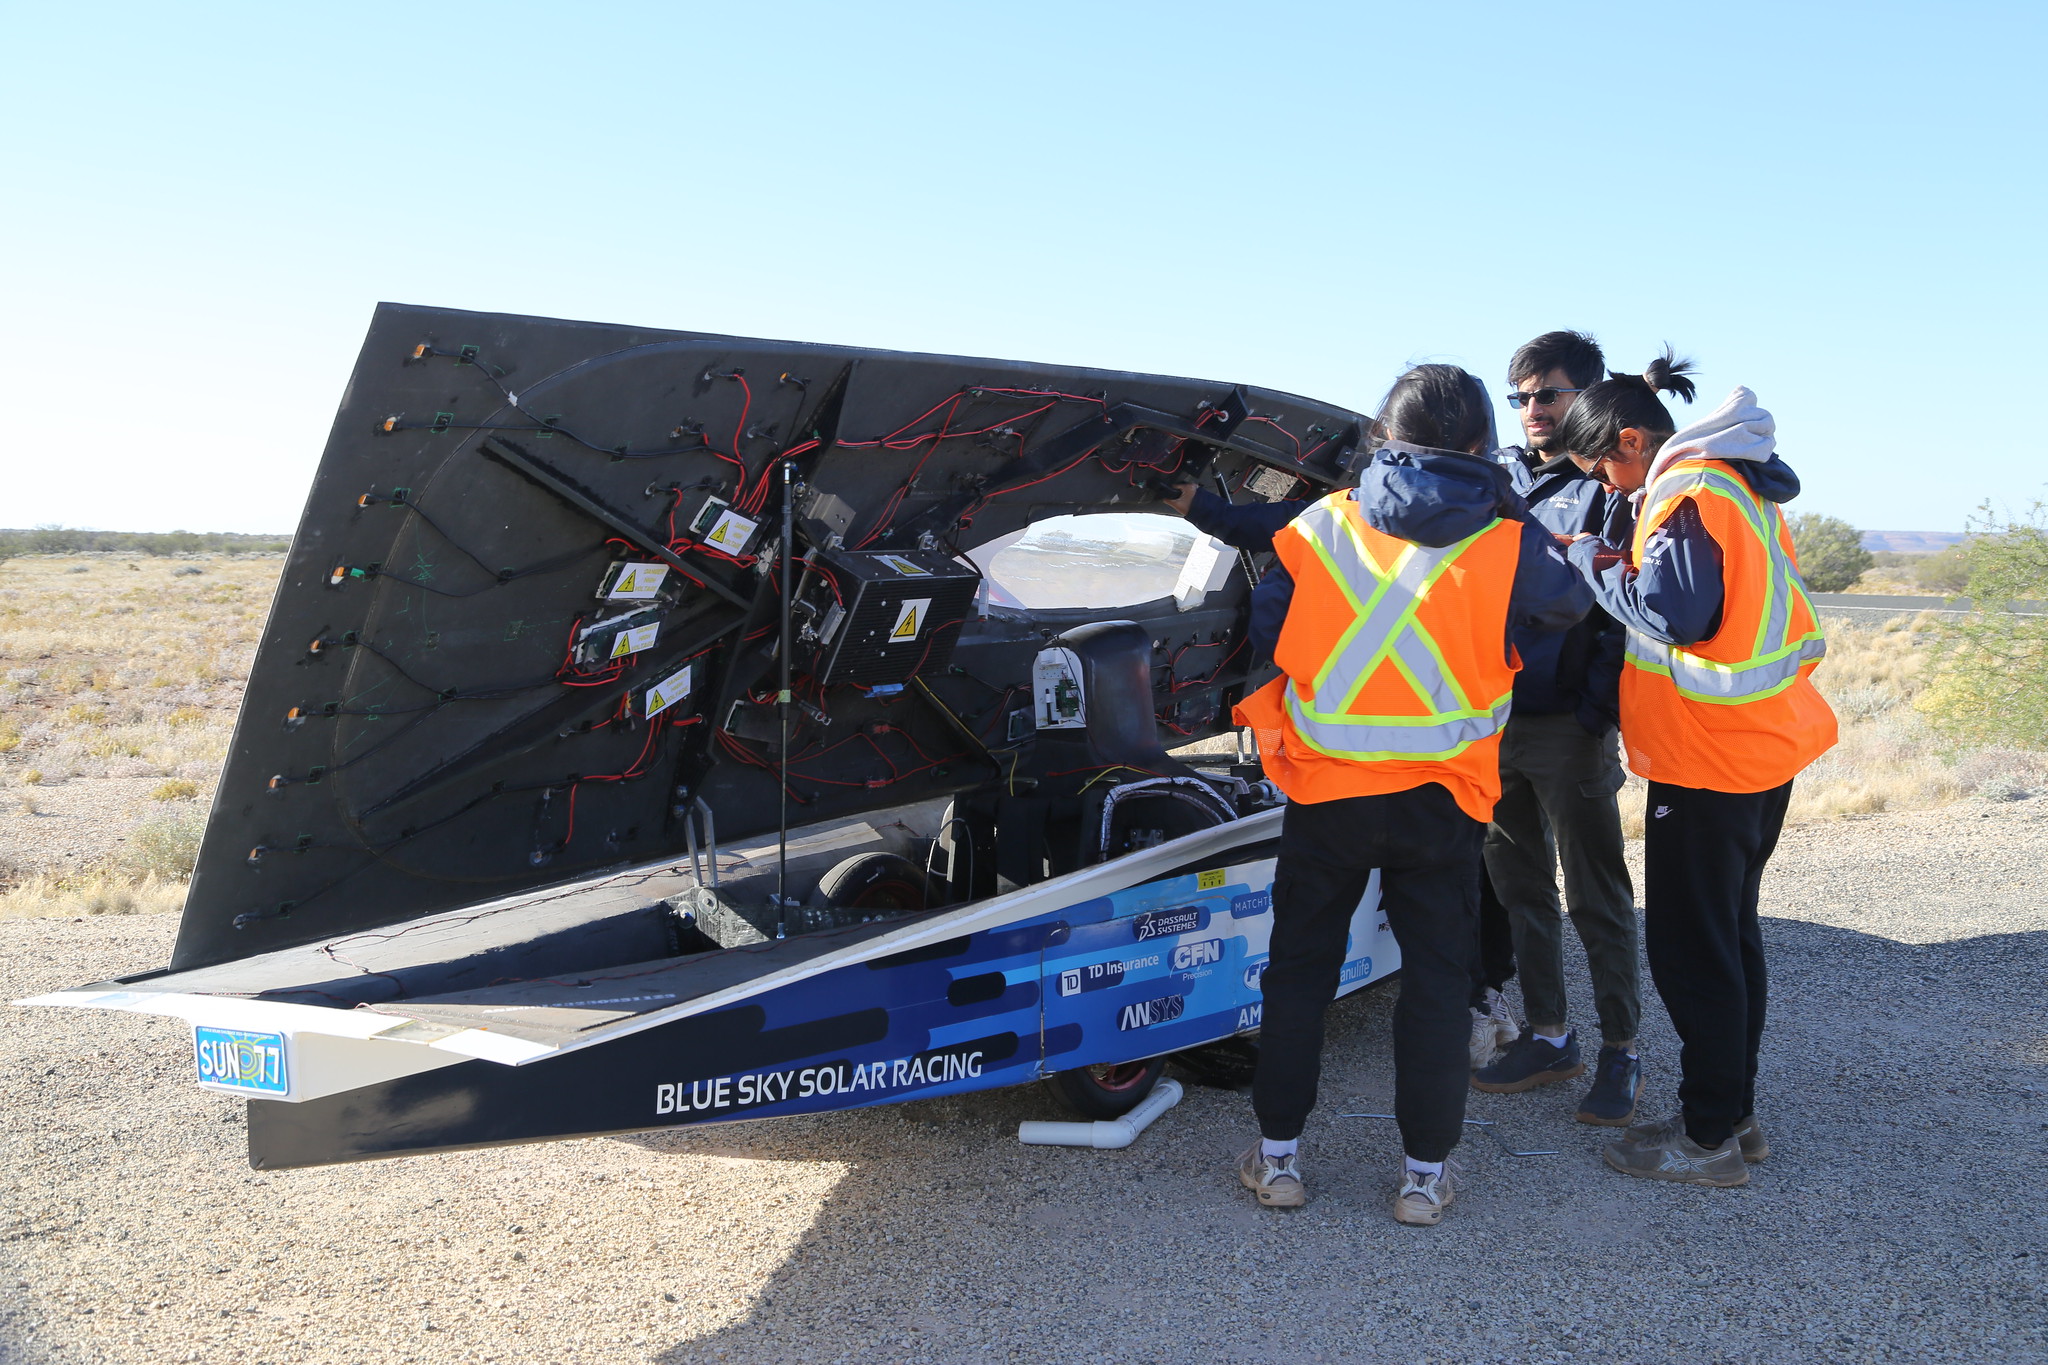
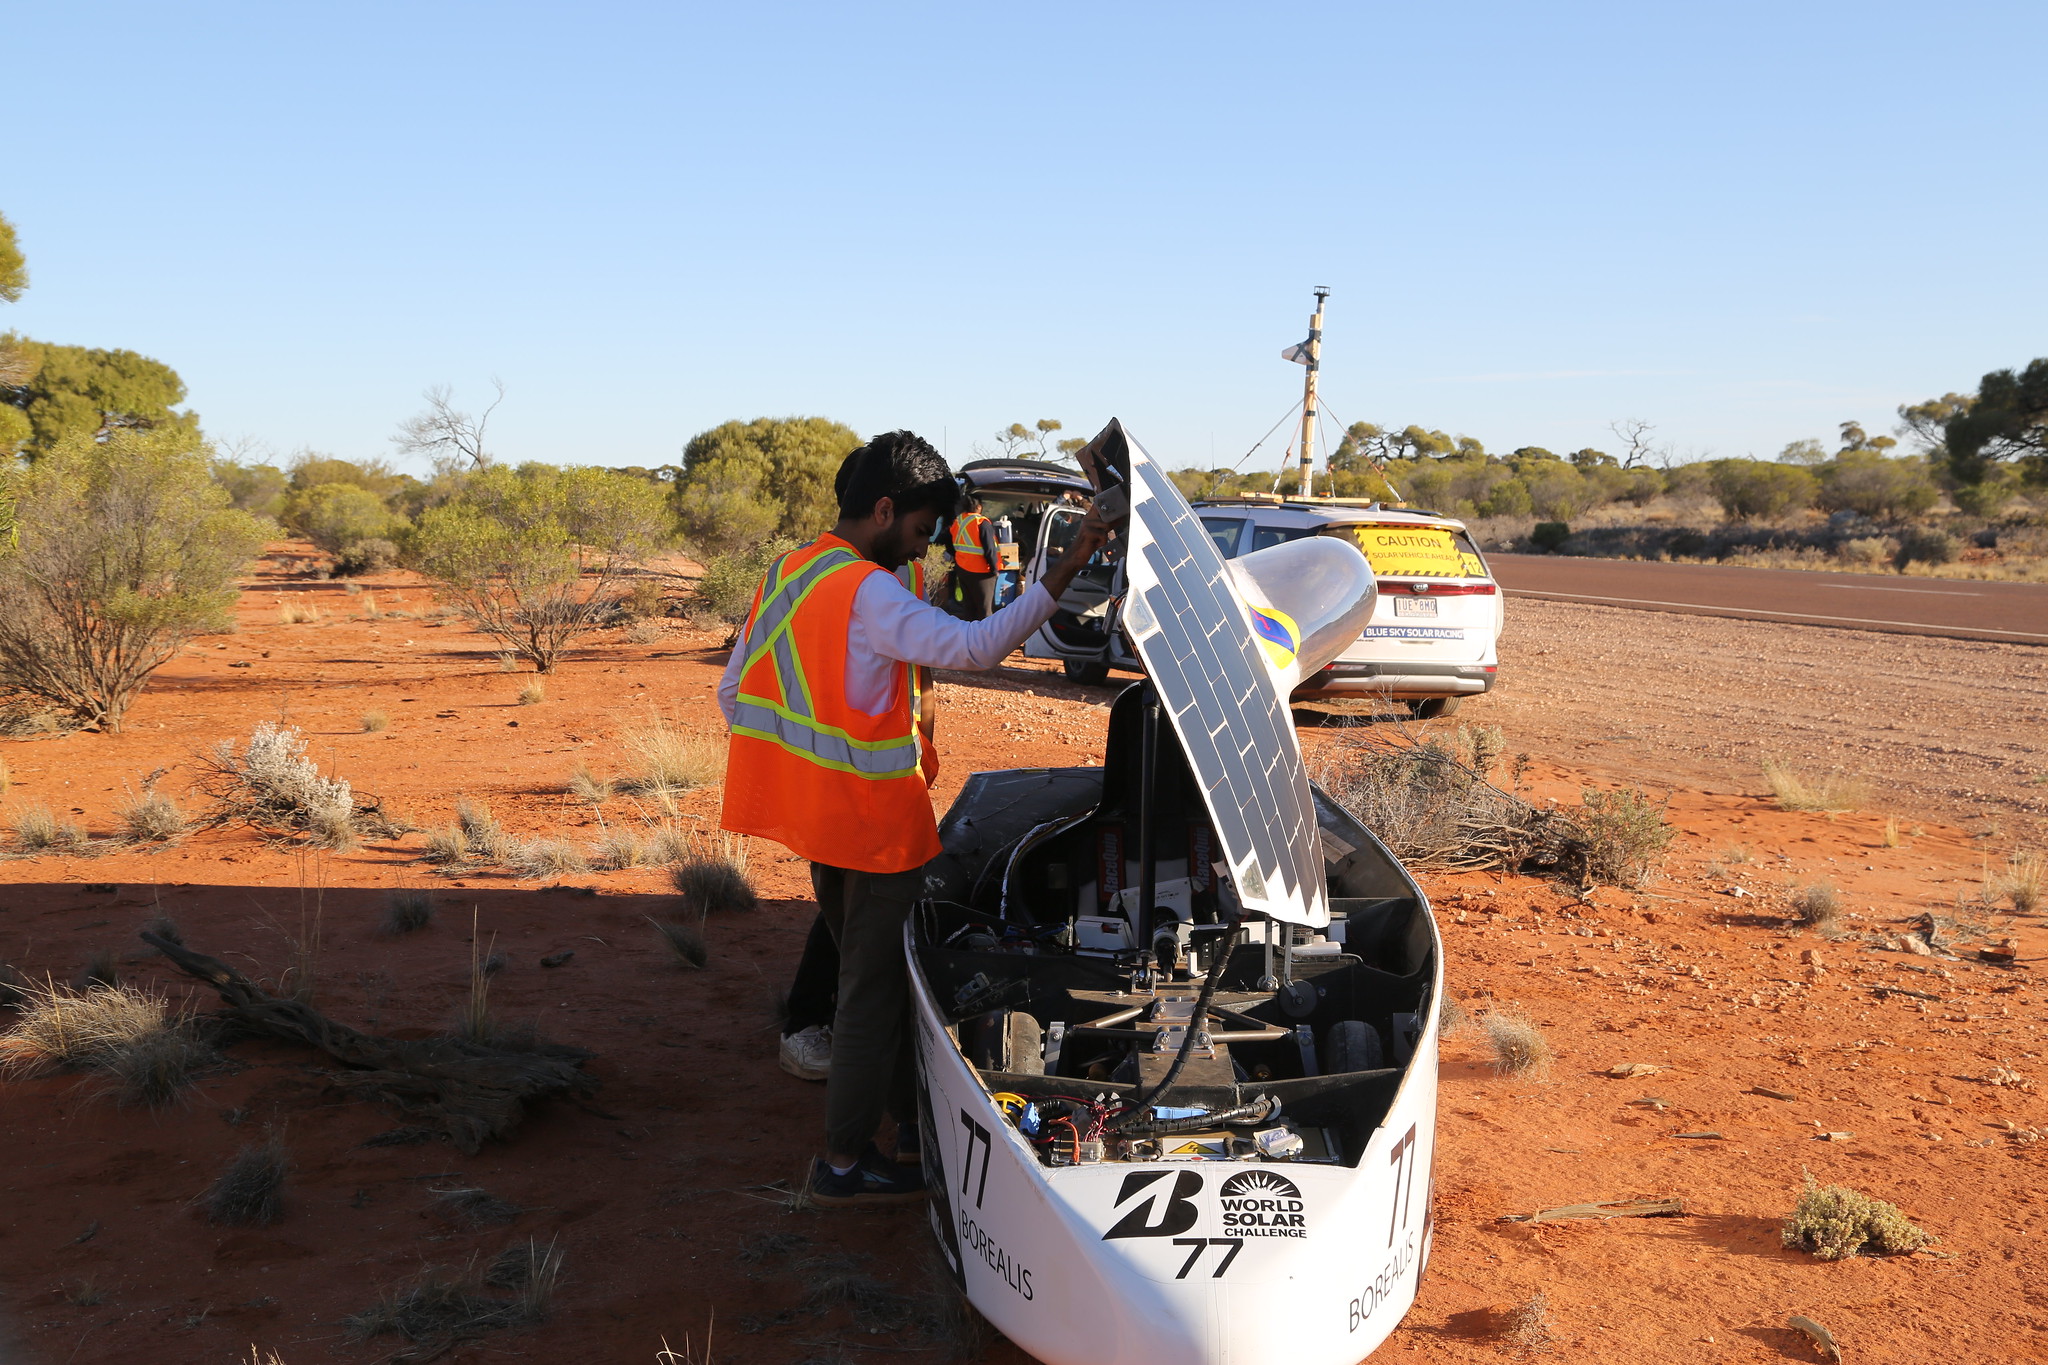
Testing of the solar car again and again gave us reliability at the end. The team went through days and days of testing over the months. Including testing on the university campus, testing on parking lots, testing on race tracks, and on actual roads.
The testing days were hard. Beside the logistics aspect, there were many technical issues the team had to fix. Staying all night to fix a problem a day before the race was a common theme. However, without testing we would have had serious problems during the actual race.
The electrical team was dealing with issues like a blown isolator, lose of commmunication due to poor ethernet connections, wrong voltage and current readings, Battery Management System not working, voltage converters not working, and many more. Solar cars require a complex electrical system architecture not really seen in any other student design teams. The reliability we were able to achieve during the race was a result of many real world testings.
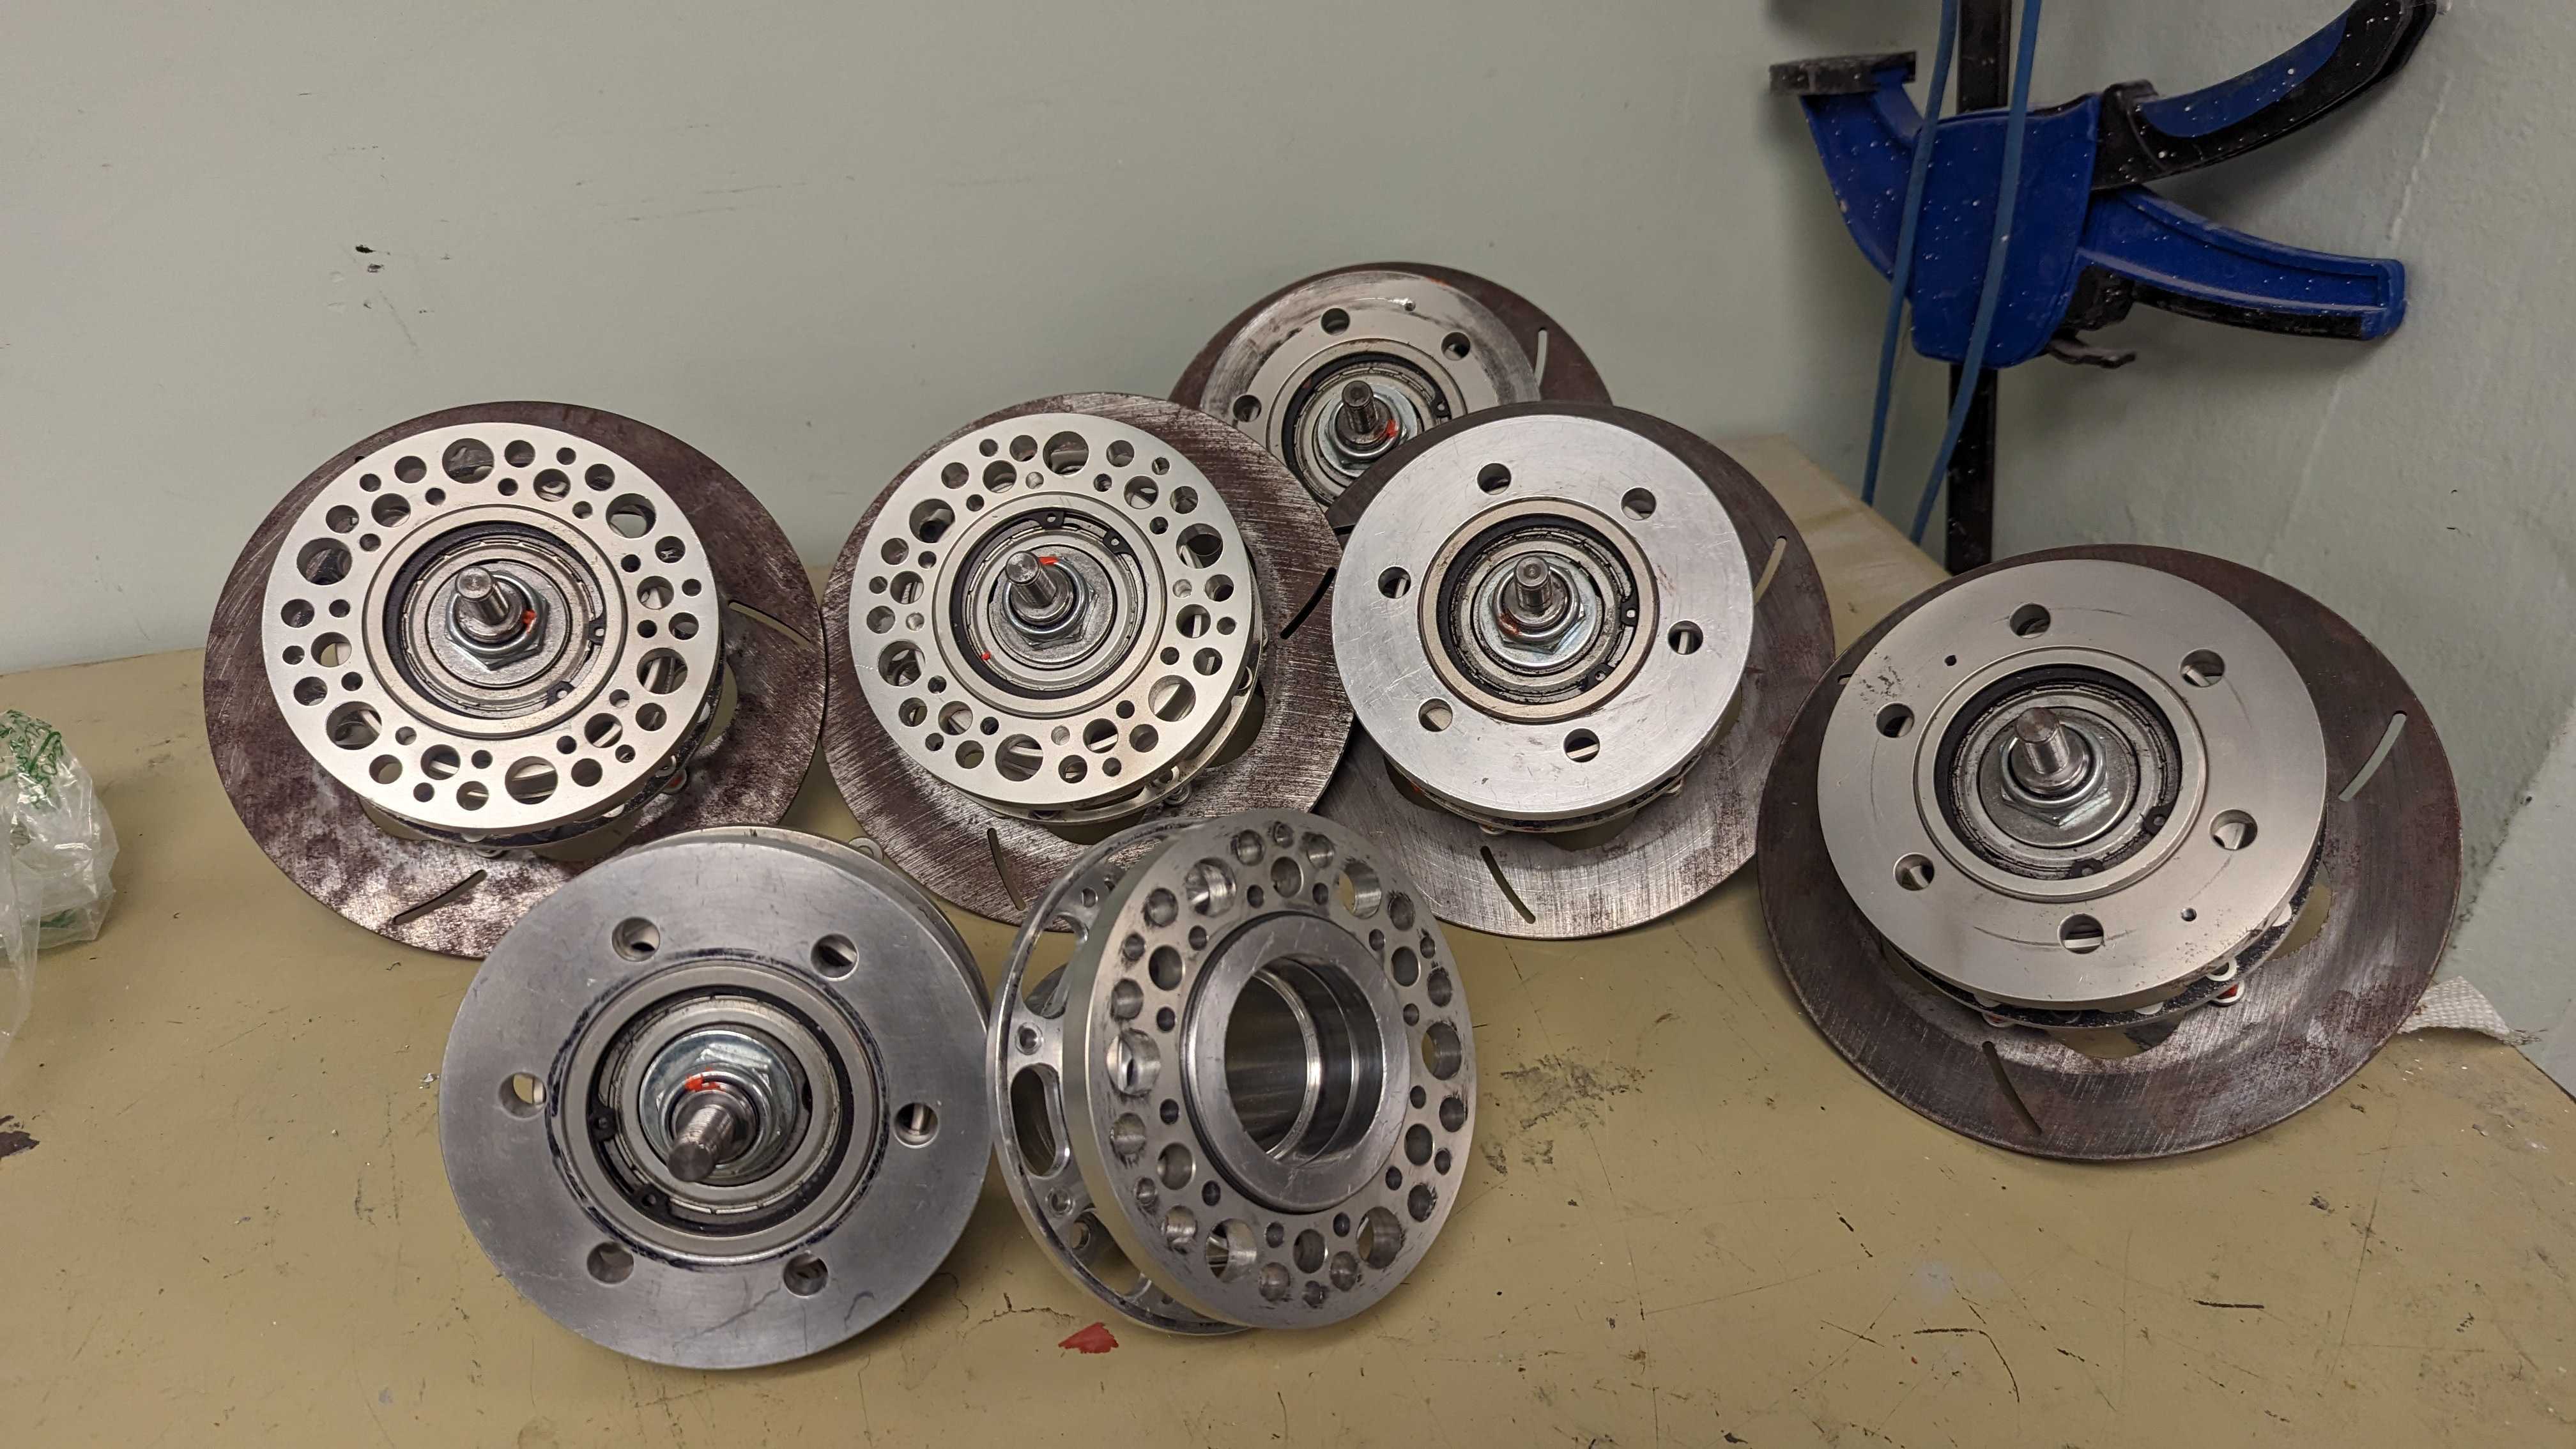
The mechanical team had to fix many issues as well prior to the race. An example I find interesting is a thread getting seized. During the initial testing days, we were experiencing a certain thread on the wheel hub getting seized randomly, no matter how much torque we applied, we could not loosen it. This issue popped up multiple times and every time we had to cut through the aluminum part and totally break it. Machining those parts was very expensive as well. One day, after some research I was able to find the source of the problem: Galling. Galling is a phenomenon that happens when similar metals (usually aluminum) get welded to each other in a high friction low torque manner due to its high ductility. The solution was a $20 anti-seize. Anodization is a solution as well due to increasing the surface hardness, however, a more expensive option.